
Assessment of Physical Growth and Nutritional Status in Children: Clinical Significance of Anthropometric Measurements, Growth Charts and Early Detection of Growth Disorders
1. Altynai Nuralieva
2. Vishwa Balamurugan
(1. Lecturer, International Medical Faculty, Osh State University, Osh, Kyrgyz Republic
2. Student, International Medical Faculty, Osh State University, Osh, Kyrgyz Republic.)
Abstract
Background. Growth is one of the most sensitive indicators of a child’s health. Faltering growth, excessive weight gain and abnormal stature are often the first visible sign of an underlying nutritional, endocrine, chronic or social problem, yet they are easy to miss when measurements are taken carelessly or interpreted without a reference.
Aim. To summarize current knowledge on how physical growth and nutritional status are assessed in children, with emphasis on anthropometry, growth charts and the early detection of growth disorders.
Methods. A narrative review of international guidelines, WHO technical documents, landmark Lancet series papers, growth-reference publications and clinical consensus statements.
Main findings. Accurate, standardized measurement of weight, length or height, head circumference and mid-upper arm circumference is the foundation of assessment. The WHO Child Growth Standards (birth to 5 years) and the WHO Growth Reference (5–19 years) allow interpretation through z-scores and percentiles, and they distinguish stunting, wasting, underweight and overweight as separate problems. Serial plotting and growth velocity are more informative than a single point. Measurement error, differing references, the limits of BMI and unequal access to care remain the main obstacles. Growth assessment is a simple, inexpensive and powerful clinical skill. Used correctly and repeatedly, it detects disease early, when intervention is most effective.
Keywords: physical growth; nutritional status; anthropometric measurements; growth charts; growth disorders; child development; pediatric assessment
1. Introduction
1.1. Importance of physical growth assessment in children
A pediatrician who wants a quick, honest read on how a child is doing will usually reach for a tape measure and a scale before anything else. Growth integrates genetics, nutrition, hormones, infection, emotional security and the circumstances in which a family lives. When one of these is disturbed for long enough, the growth curve bends. For that reason growth has often been called a mirror of child health, and it is the one clinical parameter that is followed from the first day of life through adolescence.The public health stakes are large. Maternal and child undernutrition still account for a substantial share of child deaths and lost development in low- and middle-income countries [3,5], while overweight and obesity have risen sharply almost everywhere. Pooled data from more than 2,400 population studies show that the number of obese children and adolescents aged 5–19 years rose roughly tenfold between 1975 and 2016 [8]. Many countries now live with both problems at once, sometimes inside the same household.
1.2. Definition of physical growth and development
Growth is an increase in size: height, weight, head circumference and the mass of organs and tissues, resulting from cell multiplication and enlargement. Development is the progressive acquisition of function, such as motor skills, language, cognition and social behavior. The two overlap and influence each other, but they are measured differently. This review concerns growth, although a child who is growing poorly should always prompt a question about development too.
1.3. Relationship between growth and nutritional status
Nutritional status is the physiological state that results from the balance between nutrient intake, nutrient requirements and the body’s ability to absorb and use them. Anthropometric indicators are the most practical way of expressing it in a population or in a single child. Linear growth tends to respond slowly to chronic deficiency, whereas weight responds quickly to acute illness or short-term food shortage. This difference in tempo is the reason that stunting, wasting and underweight are not interchangeable terms and tell the clinician different stories [1,7].
1.4. Clinical importance of growth monitoring
Regular measurement allows a clinician to compare a child with a healthy reference and, more importantly, with that child’s own earlier trajectory. Many serious diseases present first as growth failure: celiac disease, inflammatory bowel disease, chronic kidney disease, hypothyroidism, growth hormone deficiency, congenital heart disease and neglect. At the other end of the spectrum, an upward crossing of weight centiles in early childhood predicts later obesity. A systematic review of screening approaches found, however, that the evidence about which criteria work best is still limited, which makes sound clinical judgement all the more important [23].
1.5. Aim and objectives of the review
The aim is to provide a practical, evidence-based overview of growth and nutritional assessment in children. The specific objectives are to (a) describe normal growth patterns and the factors that shape them; (b) explain correct anthropometric technique; (c) clarify the use of WHO growth standards and references; (d) outline clinical and laboratory assessment of nutritional status; (e) classify common growth disorders; and (f) discuss monitoring strategies, limitations and future directions.
2. Methodology of the Literature Review
This is a narrative rather than a systematic review, so it did not follow a registered protocol or a formal risk-of-bias assessment. Sources were identified through searches of PubMed and Google Scholar and through the websites of the World Health Organization and national pediatric bodies, using combinations of the terms growth charts, anthropometry, stunting, wasting, childhood obesity, short stature and growth monitoring. Priority was given to international guidelines, WHO technical reports, high-impact reviews and series, original growth-reference publications and clinical consensus statements. Articles in English were included. Older foundational papers were retained where they define methods still in use today. Selection was by relevance to clinical practice in pediatrics, and the findings are synthesized descriptively. The reader should bear in mind that a narrative approach is vulnerable to selection bias, and that the review is designed to teach and orient rather than to quantify effects.
3. Principles and Patterns of Physical Growth in Children
3.1. Definition and characteristics of physical growth
Growth is continuous but not uniform. It is orderly, following the cephalocaudal and proximodistal directions; it is individual, since each child has a genetically set channel; and it is sensitive, because it deviates when health or nutrition is compromised. Different tissues also grow on different schedules. The brain and head reach most of their adult size in early childhood, lymphoid tissue peaks in mid-childhood, and the reproductive system matures in adolescence, while height and weight follow a characteristic S-shaped course.
3.2. Stages of growth from birth to adolescence
Clinically it is useful to think of four broad phases. In infancy (0–2 years) growth is fastest and most dependent on nutrition. In early childhood (2–5 years) the rate slows and appetite often becomes erratic, which worries parents far more than it should. In middle childhood (about 5 years to puberty) growth is steady and predictable. In adolescence a pubertal growth spurt, driven by sex steroids acting together with growth hormone and IGF-1, produces a rapid gain in height and a marked change in body composition [24]. Figure 1 illustrates these stages.
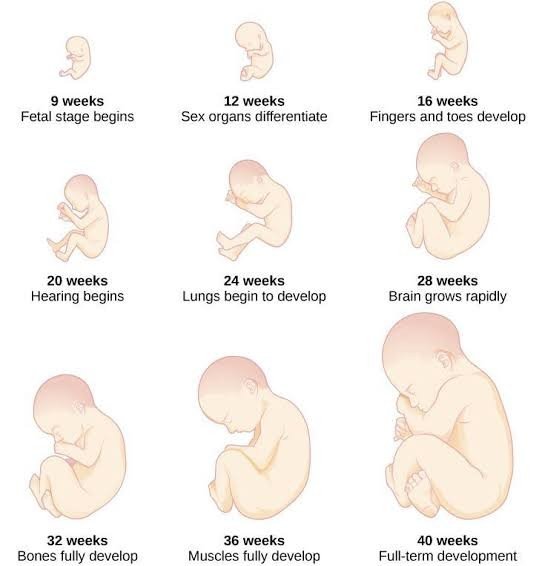
Figure 1. Stages of physical growth from infancy.
3.3. Normal patterns of height and weight gain
A term newborn measures about 50 cm and weighs about 3.3 kg. Birth weight roughly doubles by 4–5 months and triples by the first birthday. Length increases by about 25 cm in the first year, 10–12 cm in the second, and around 7–8 cm in the third. After that, a healthy child grows about 5–6 cm each year until puberty. Head circumference is approximately 35 cm at birth and grows by about 12 cm during the first year, which reflects the speed of early brain growth. These figures are averages; the WHO standards give precise values for each age and sex [1].
3.4. Growth velocity and developmental variations
Velocity, meaning the increment over a defined time, is often more revealing than attained size. During the pubertal spurt peak height velocity reaches roughly 8–9 cm per year in girls, usually around 11–12 years, and about 9–10 cm per year in boys, usually two years later [24]. Several normal variants can mimic disease. Children with constitutional delay of growth and puberty are short during early adolescence, have a delayed bone age and a family history of late puberty, and eventually reach a normal adult height. Familial short stature produces a child who is small but grows at a normal velocity along a low centile. Around the ages of 6 to 18 months many healthy infants also drift across centiles toward their genetic channel, which is normal “canalization” and not a disorder.
3.5. Individual and population differences
Two healthy children of the same age can differ in height by more than 10 cm. Part of this is genetic; adult height is about 80% heritable, and hundreds of common genetic variants each add a small effect [18,19]. Another part reflects population history. For many years it was debated whether children from different regions should be compared with different references. The WHO Multicentre Growth Reference Study showed that, when children are raised in favorable conditions, differences in linear growth between populations are small, with the major differences in the real world being attributable to nutrition, infection and environment rather than ethnicity [25]. That finding underpins the use of a single international standard.
3.4. Clinical significance of growth patterns
Understanding the normal pattern is what makes an abnormal one recognizable. A child whose length-for-age is falling between 6 and 24 months, whose weight has flattened before height does, or whose BMI has been rising quickly since age 3 is showing a pattern that deserves investigation. Doctors who learn these patterns by heart notice problems sooner.
4. Factors Influencing Physical Growth and Development
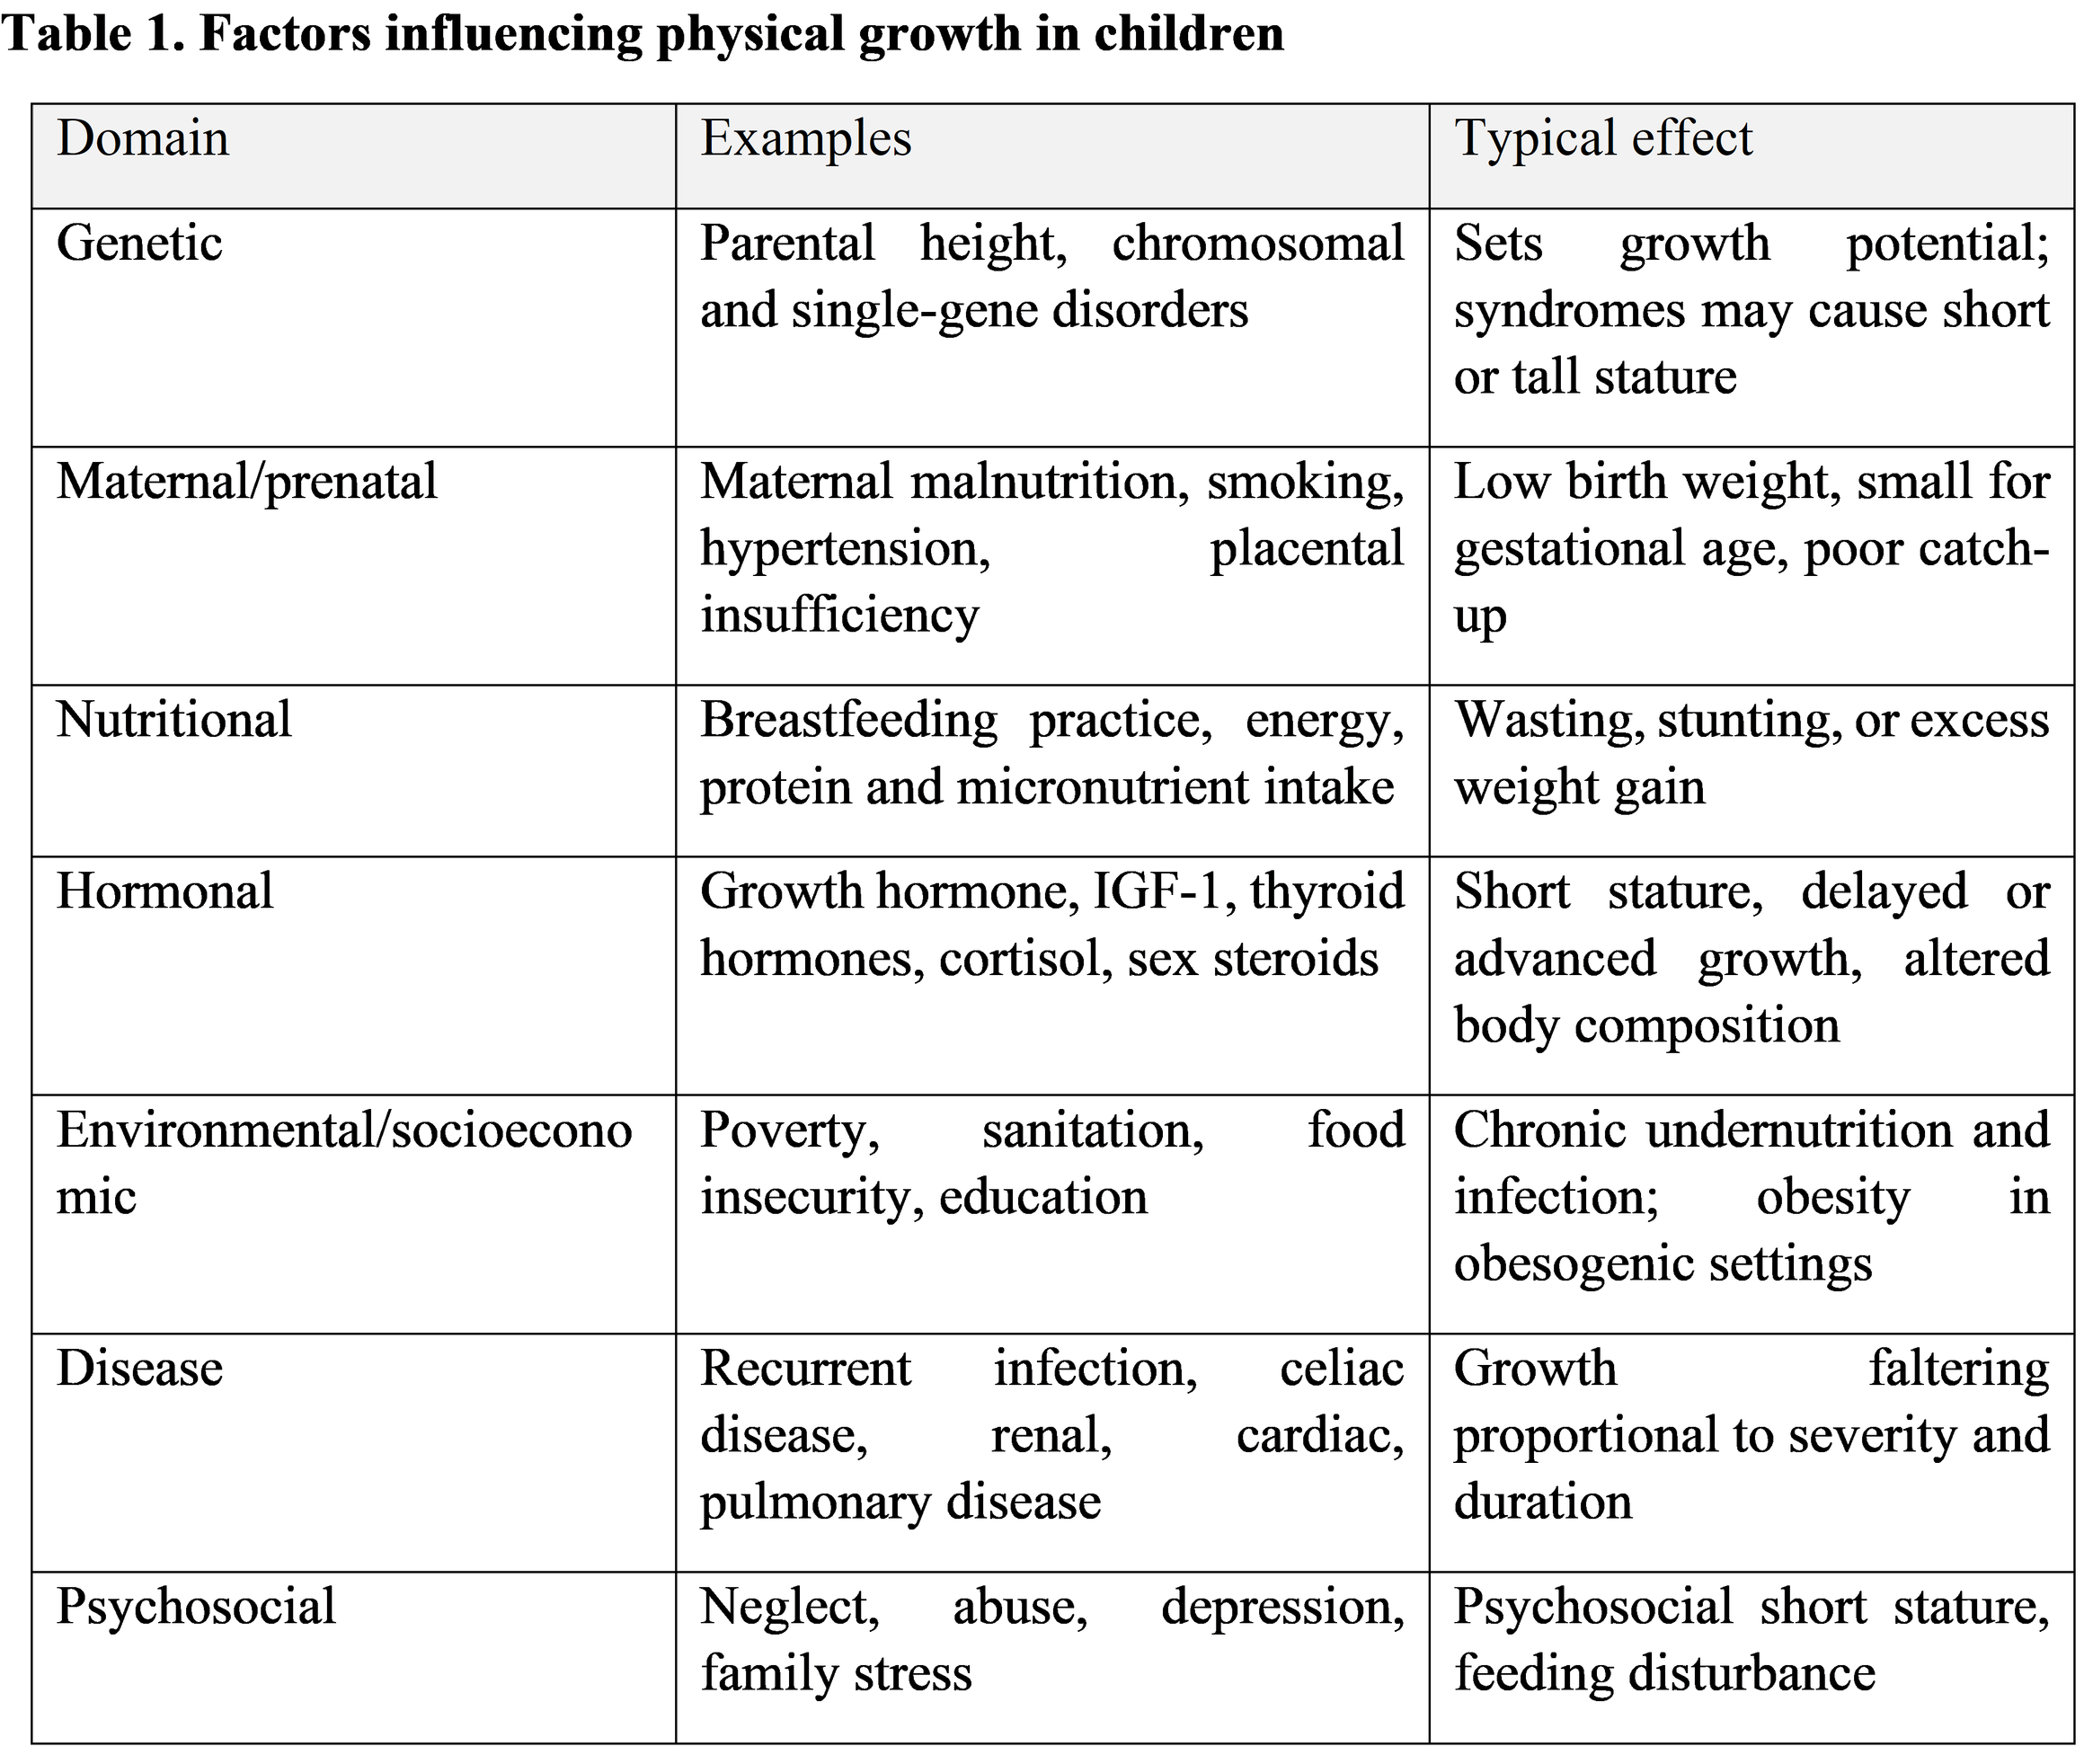
Growth results from the interaction of many determinants (Table 1). They are described separately below for clarity, although in a real child they rarely act alone.
4.1. Genetic and hereditary factors
Genes establish the range within which a child can grow. Parental heights provide a simple estimate: the mid-parental height is the average of the parents’ heights, plus 6.5 cm for boys and minus 6.5 cm for girls, with a target range of roughly ±8.5 cm. Chromosomal and single-gene conditions such as Turner syndrome, Down syndrome, Noonan syndrome and SHOX deficiency can change this range. Genome-wide studies have now identified hundreds of loci that contribute to height, confirming that normal stature is highly polygenic [19].
4.2. Maternal and prenatal factors
The period from conception to the second birthday, often called the first 1,000 days, has an outsized effect on later size and health. Poor maternal nutrition, short interpregnancy interval, adolescent pregnancy, smoking, hypertension and placental insufficiency all increase the likelihood of being born small for gestational age or preterm. The developmental-origins literature argues that early conditions program metabolism and body composition, with consequences for adult obesity and cardiometabolic disease [17]. Poor growth in the womb is also linked to stunting later, and this is one of the strongest arguments for improving maternal health before and during pregnancy [4].
4.3. Nutritional factors
Adequate energy, protein, essential fatty acids and micronutrients are non-negotiable for growth. Exclusive breastfeeding for the first six months, followed by safe and diverse complementary foods, is the basis of recommended infant feeding, and failure to provide this is a leading cause of faltering growth in poorer settings [6]. Zinc, iron, vitamin A, vitamin D, iodine and calcium are particularly important. Excess intake, especially of energy-dense, nutrient-poor food and sugar-sweetened beverages, contributes to the opposite problem [3].
4.4. Hormonal and endocrine influences
Growth hormone and IGF-1 drive linear growth throughout childhood, thyroid hormone is required for skeletal maturation and brain development, and sex steroids trigger and then terminate the pubertal spurt by promoting epiphyseal closure. Excess cortisol, whether endogenous or from prolonged glucocorticoid treatment, suppresses growth and promotes central adiposity. Insulin has strong anabolic effects, which is one reason why children of mothers with diabetes are often larger at birth [20].
4.5. Environmental and socioeconomic factors
Household income, parental education, sanitation, food security, access to health care and the physical environment determine whether a child’s genetic potential is realized. Repeated diarrheal and respiratory infections compromise absorption and appetite and create a cycle of infection and undernutrition. In wealthier societies, low physical activity, screen time, marketing of unhealthy foods and neighborhood design shape the risk of excess weight. Because the same social factors that cause stunting in one region can cause obesity in another, context matters when growth data are interpreted [3,7].
4.6. Chronic diseases and infections
Almost any chronic illness can impair growth by decreasing intake, increasing losses, raising energy needs or interfering with endocrine function. Celiac disease can present with short stature alone. Crohn disease may reduce growth years before gut symptoms are obvious. Chronic kidney disease, cystic fibrosis, congenital heart disease, chronic anemia, asthma needing high-dose steroids and HIV infection all appear on the differential diagnosis of poor growth. Severity and timing matter: an illness during infancy or around puberty has a bigger effect than the same illness in mid-childhood.
4.7. Psychological and social factors
Emotional deprivation and abuse can slow growth even when food is available, a condition historically called psychosocial short stature. Children in these situations may show altered growth hormone secretion, feeding problems and developmental delay, and growth often improves when the environment improves. Depression, eating disorders and family conflict also affect appetite and weight in older children and adolescents. A growth chart that does not match the story the parents tell should alert the clinician to ask gently about the home.
5. Anthropometric Measurements in Pediatric Practice
5.1. Definition and importance of anthropometry
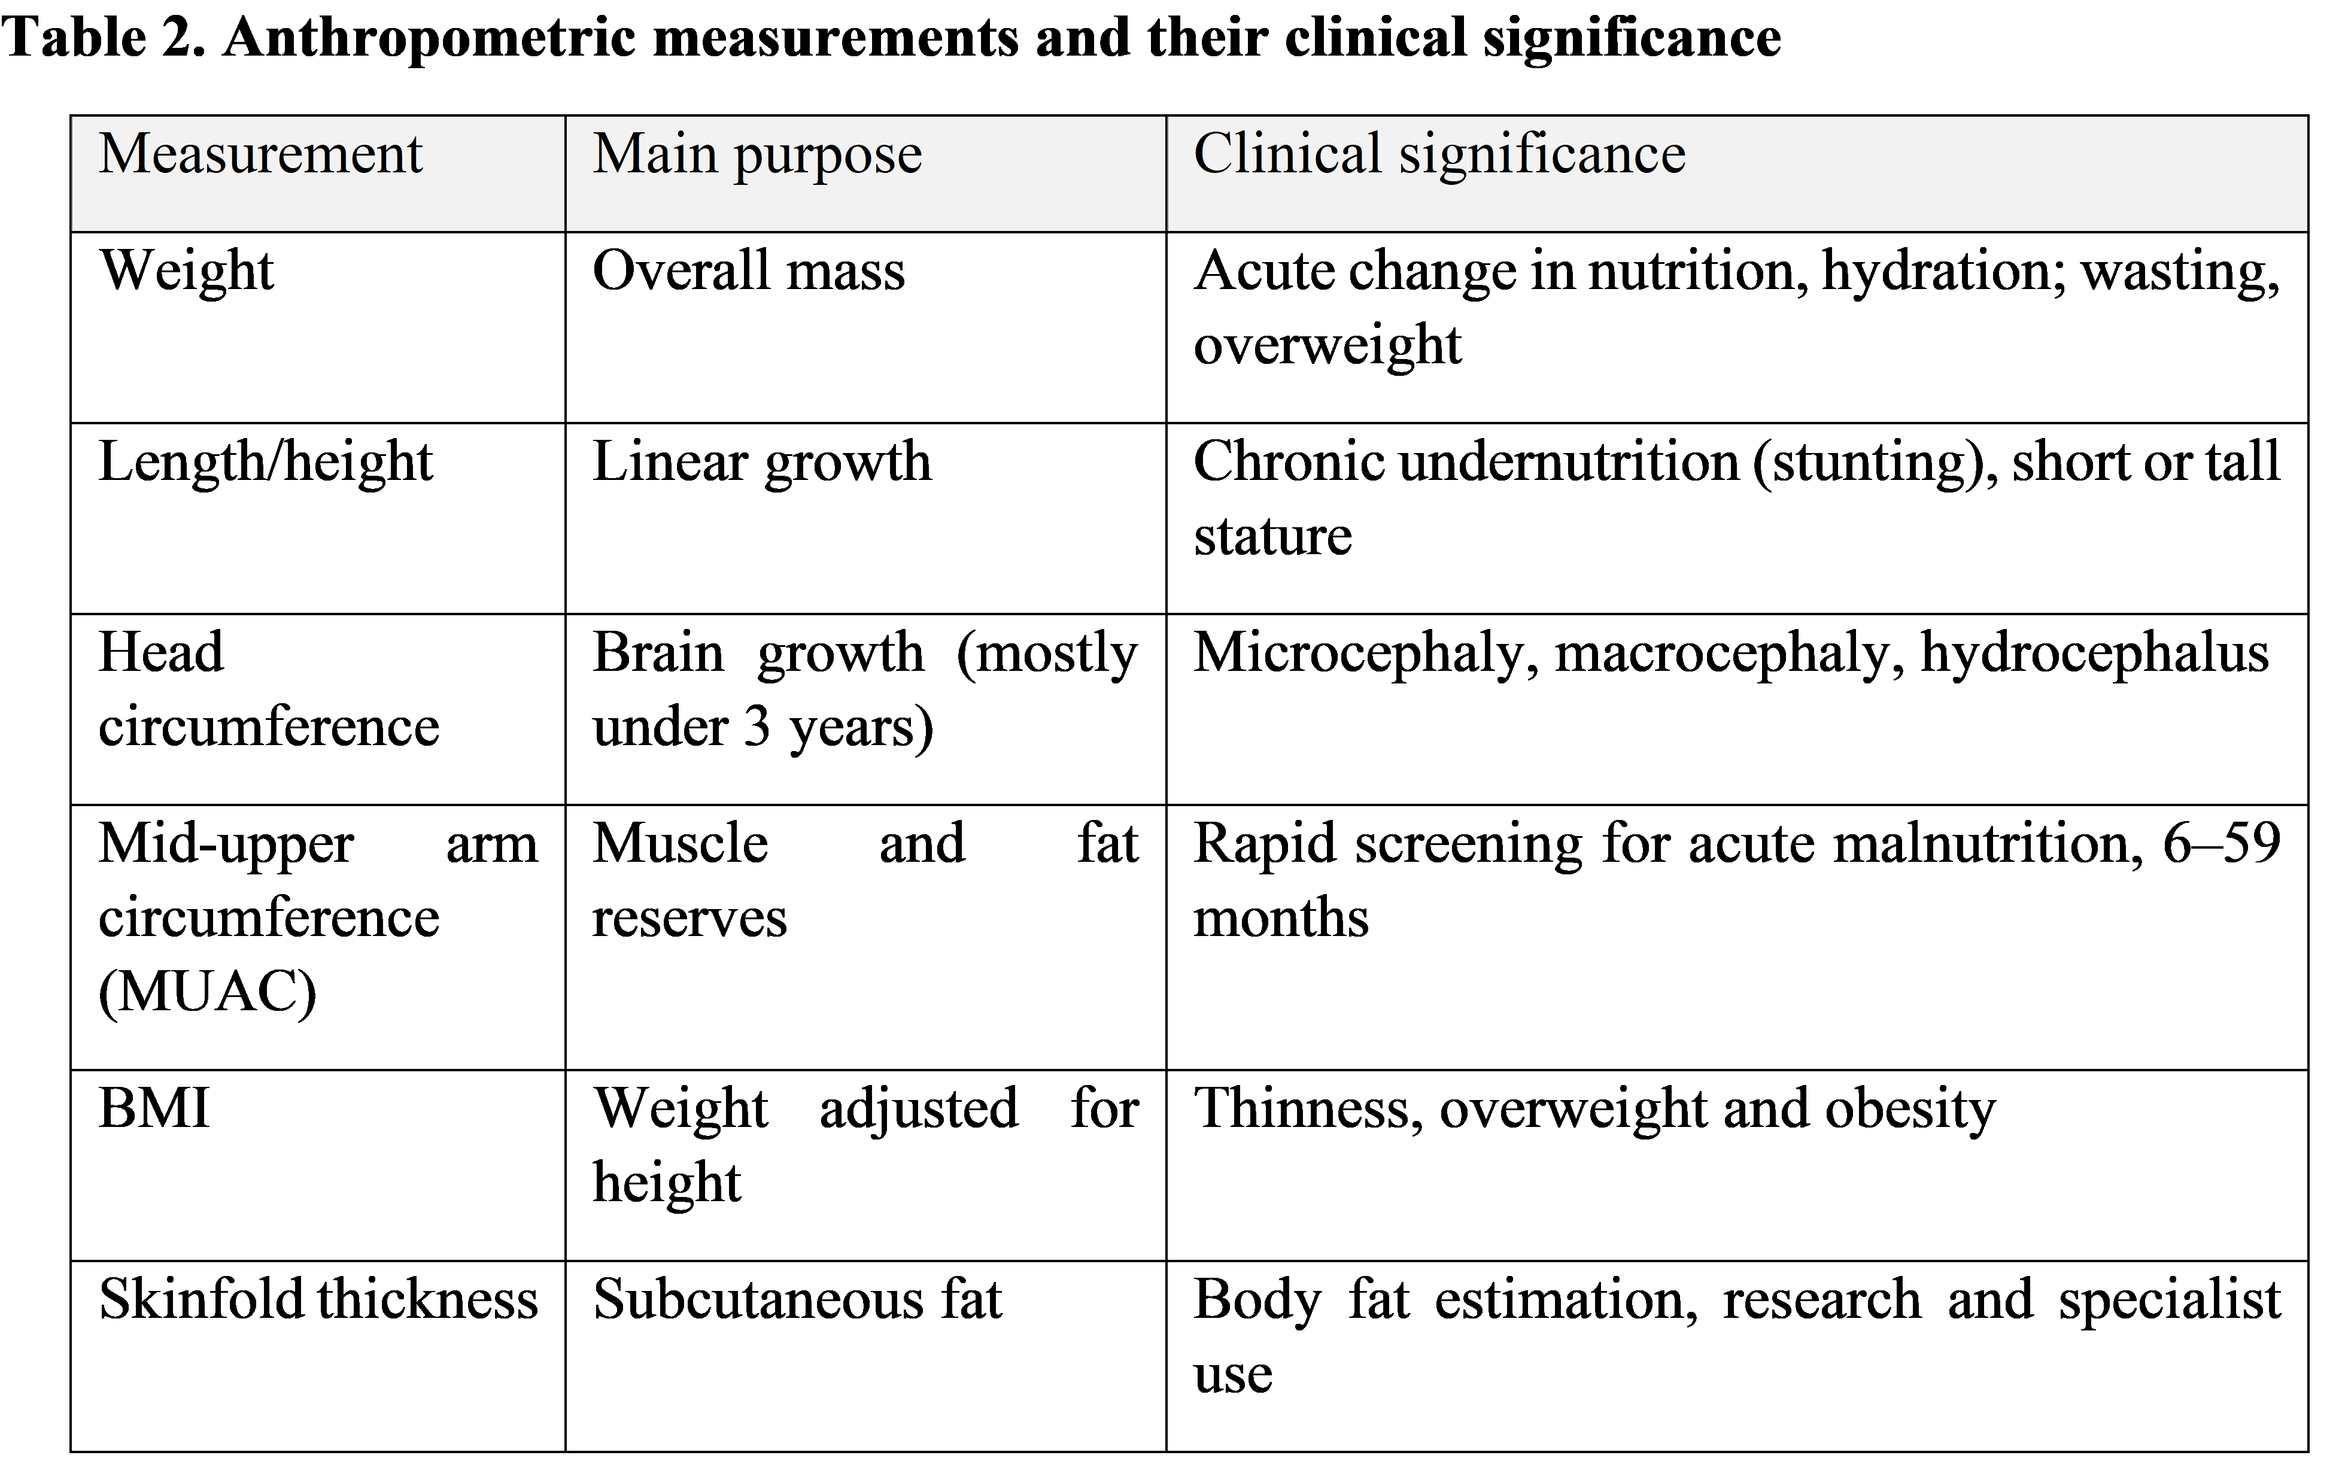
Anthropometry is the measurement of the size, proportions and composition of the body. It is non-invasive, inexpensive, portable and reproducible, which is why it remains the cornerstone of nutritional assessment worldwide. Its weakness is that it is only as good as the person doing it, and small errors repeated across a population or across visits can change a child’s classification [14].
5.2. Measurement of body weight
Infants under about two years are weighed on a calibrated pan or electronic scale, naked or in a clean dry diaper, with the scale zeroed beforehand. Older children are weighed standing still, in light clothing and without shoes, on a calibrated digital scale placed on a firm, level surface. Weight should be recorded to the nearest 10 g in infants and the nearest 100 g in older children. Time of day, recent feeding and clothing all influence the reading, so these conditions should be kept as consistent as possible between visits [15].
5.3. Measurement of length and height
Children younger than 2 years are measured lying down (recumbent length) on an infantometer with a fixed headboard and a movable footboard. Two people are needed: one holds the head in the Frankfurt plane with the crown against the board, while the other straightens the legs and brings the footboard firmly against the soles. From 2 years of age children stand against a stadiometer with heels, buttocks, shoulders and head touching the upright, looking straight ahead. Because recumbent length exceeds standing height by about 0.7 cm, the WHO standards adjust for this difference when a child is measured the “wrong” way for their age [1,15]. Measurements are recorded to the nearest 0.1 cm and should be repeated until two readings agree closely.
5.4. Measurement of head circumference
A flexible, non-stretchable tape is placed just above the eyebrows and ears and around the most prominent part of the back of the head. The maximum of several readings is taken. Head circumference is routinely monitored until about 2 to 3 years of age. A value more than 2 standard deviations below or above the median defines microcephaly or macrocephaly, but the trend and the parents’ own head sizes are essential for interpretation. Rapid upward crossing of centiles may indicate hydrocephalus or other intracranial pathology, while a falling curve suggests impaired brain growth.
5.5. Measurement of mid-upper arm circumference (MUAC)
MUAC is measured on the left arm, hanging relaxed, at the midpoint between the tip of the acromion and the olecranon, using a non-stretchable tape or color-coded strip. For children 6 to 59 months, a MUAC below 115 mm indicates severe acute malnutrition and a value from 115 to under 125 mm indicates moderate acute malnutrition. Its simplicity makes it ideal for community screening, even by non-professionals, though it identifies a partly different group of children from those found by weight-for-height, and the two should not be treated as fully equivalent [16].
5.6. Assessment of body mass index (BMI)
BMI is weight in kilograms divided by height in meters squared. In children it is meaningful only when plotted against age and sex, since normal values change considerably from infancy to adolescence. It is the recommended screening tool for overweight and obesity from 5 years and, as BMI-for-age, can also identify thinness. It does not distinguish fat from lean mass, so a muscular adolescent athlete may be misclassified, and it should always be combined with clinical judgement [9,10].
5.6a. Measurement of skinfold thickness
Skinfold calipers estimate subcutaneous fat. Triceps and subscapular sites are most often used, with the skinfold lifted firmly between thumb and finger, and the caliper applied one centimeter away, with the reading taken after a few seconds. Skinfolds offer more direct information on adiposity than BMI but demand a high level of skill and are subject to large inter-observer variation, so they are mostly used in research or specialist clinics.
5.7. Standardization and accuracy
Accuracy depends on equipment, technique and training. Equipment should be checked and calibrated regularly. Staff should be trained to a common protocol, and inter- and intra-observer reliability should be tested periodically. The multicentre study that produced the WHO standards used rigorously standardized procedures, reference measurers and repeated training, and it still reported residual measurement error, which is a useful reminder for clinical practice [15].
5.8. Common errors in pediatric anthropometry
The usual mistakes are well known and mostly avoidable: uncalibrated scales; weighing children in heavy clothing; failing to position the head properly; bent knees or raised heels during height measurement; measuring a restless infant without a second person; using a tape that has stretched; rounding readings inconsistently; miscalculating age in preterm infants (who should be corrected for gestation until about 2 years); and plotting on the wrong chart. Every one of these can turn a healthy child into a worrying data point or hide a problem that is really there [14].
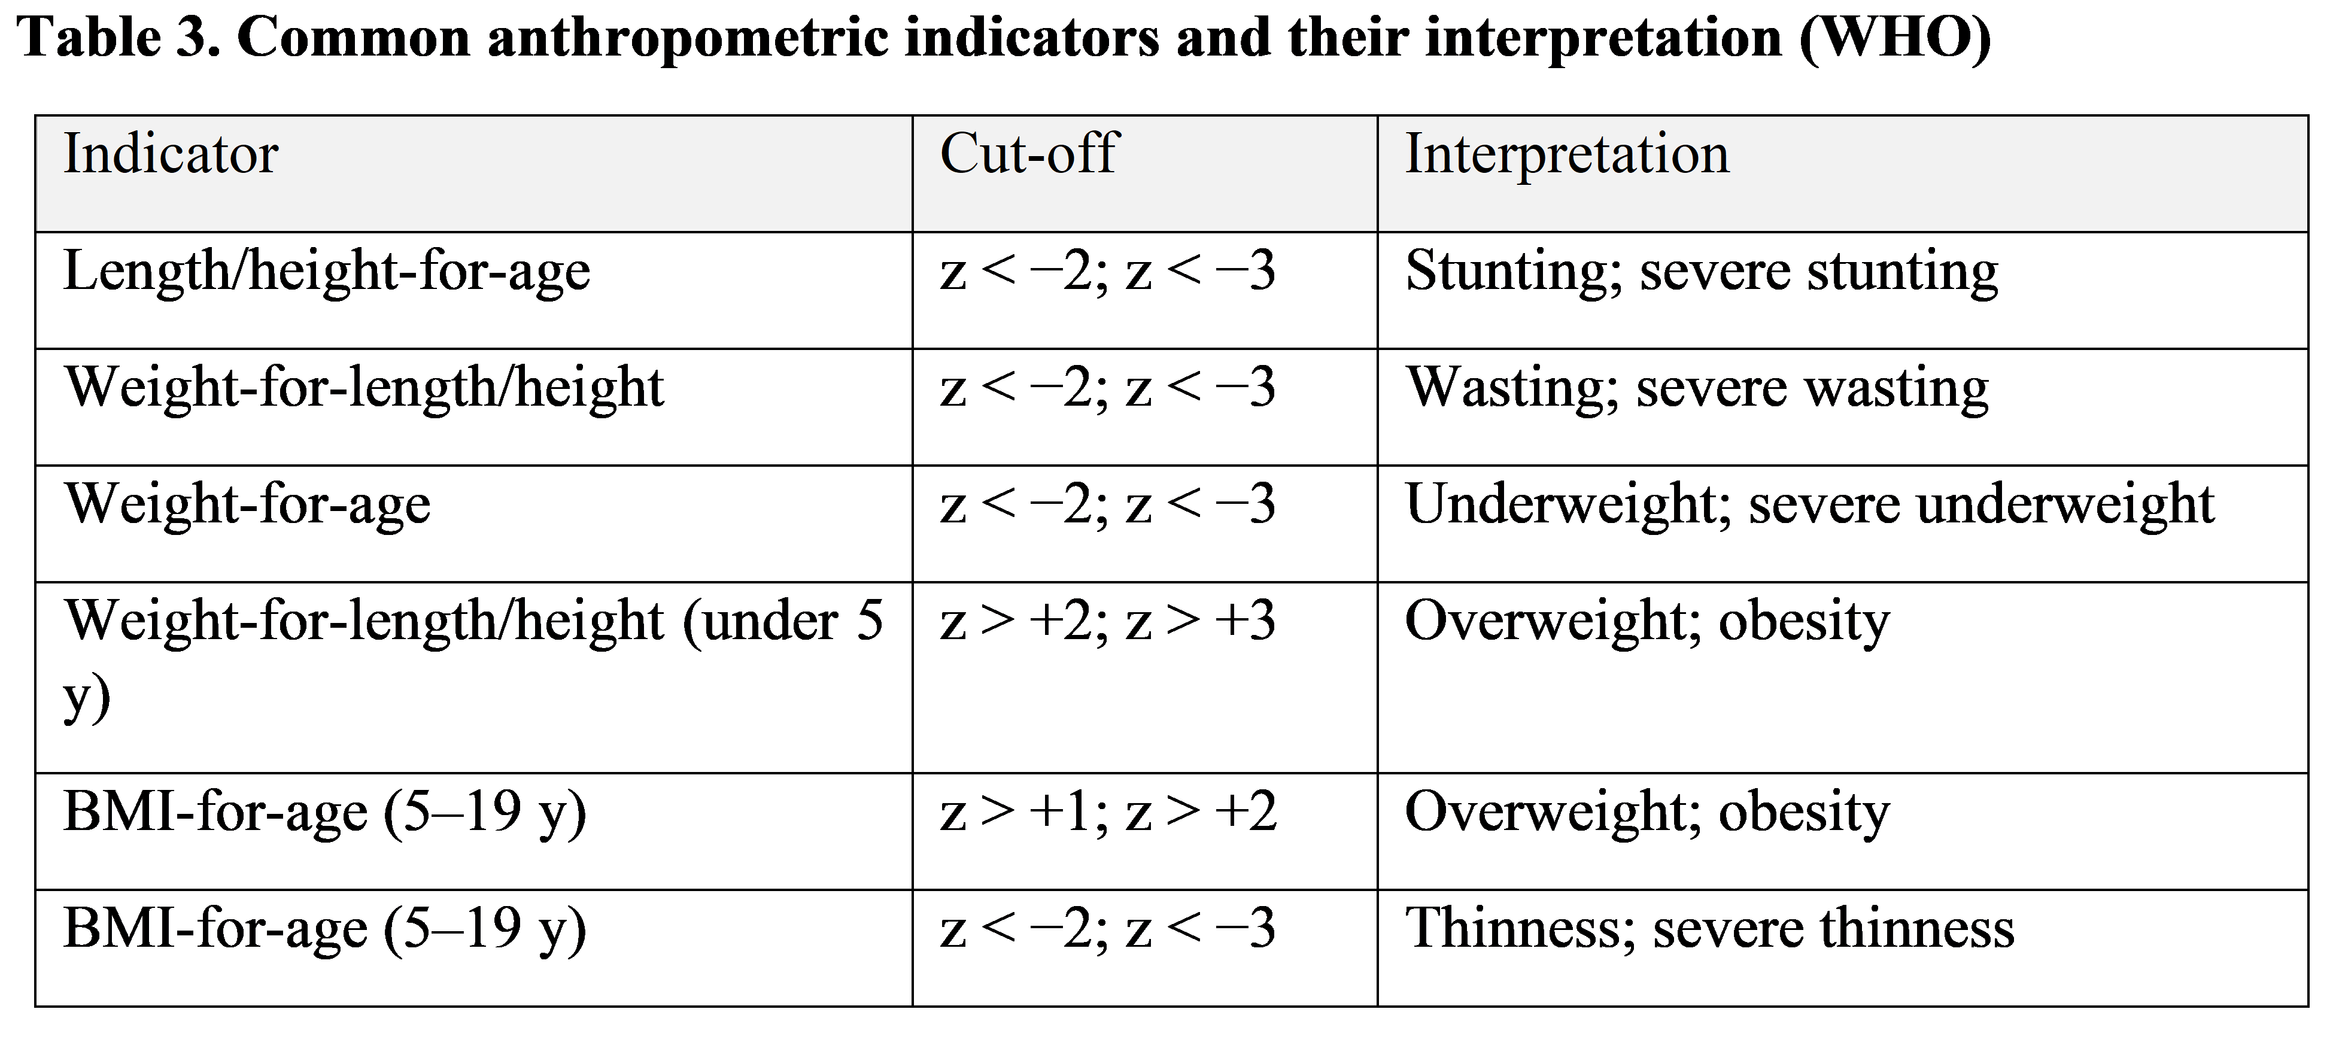
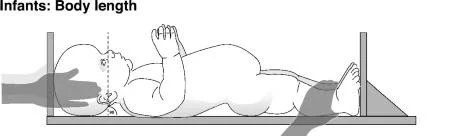
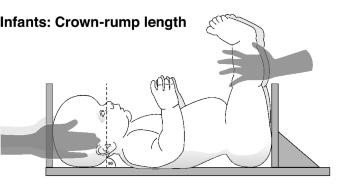
Figure 2. Standard techniques for pediatric anthropometric measurements .
6. Growth Charts and Standardized Growth References
6.1. Concept and purpose of growth charts
A growth chart is a graph on which a child’s measurements are plotted against the distribution of measurements in a reference group of the same age and sex. It allows a quick visual judgement of size, and, when several points are joined, of the pattern of growth over time. Charts are tools for screening and follow-up, not diagnostic tests on their own: a point outside the expected range is a reason to look further, not a diagnosis.
6.2. WHO Child Growth Standards
The WHO Child Growth Standards (2006) cover birth to 5 years. They were built from the Multicentre Growth Reference Study, which followed about 8,400 healthy, predominantly breastfed children from Brazil, Ghana, India, Norway, Oman and the United States, raised in conditions that favored growth and whose mothers did not smoke [1]. They are called a standard because they describe how children should grow when health and nutrition needs are met, not just how they happen to grow in a given place. They show breastfed infants as the biological norm, which is an important change from earlier references [1,12].
6.3. WHO Growth Reference for children and adolescents
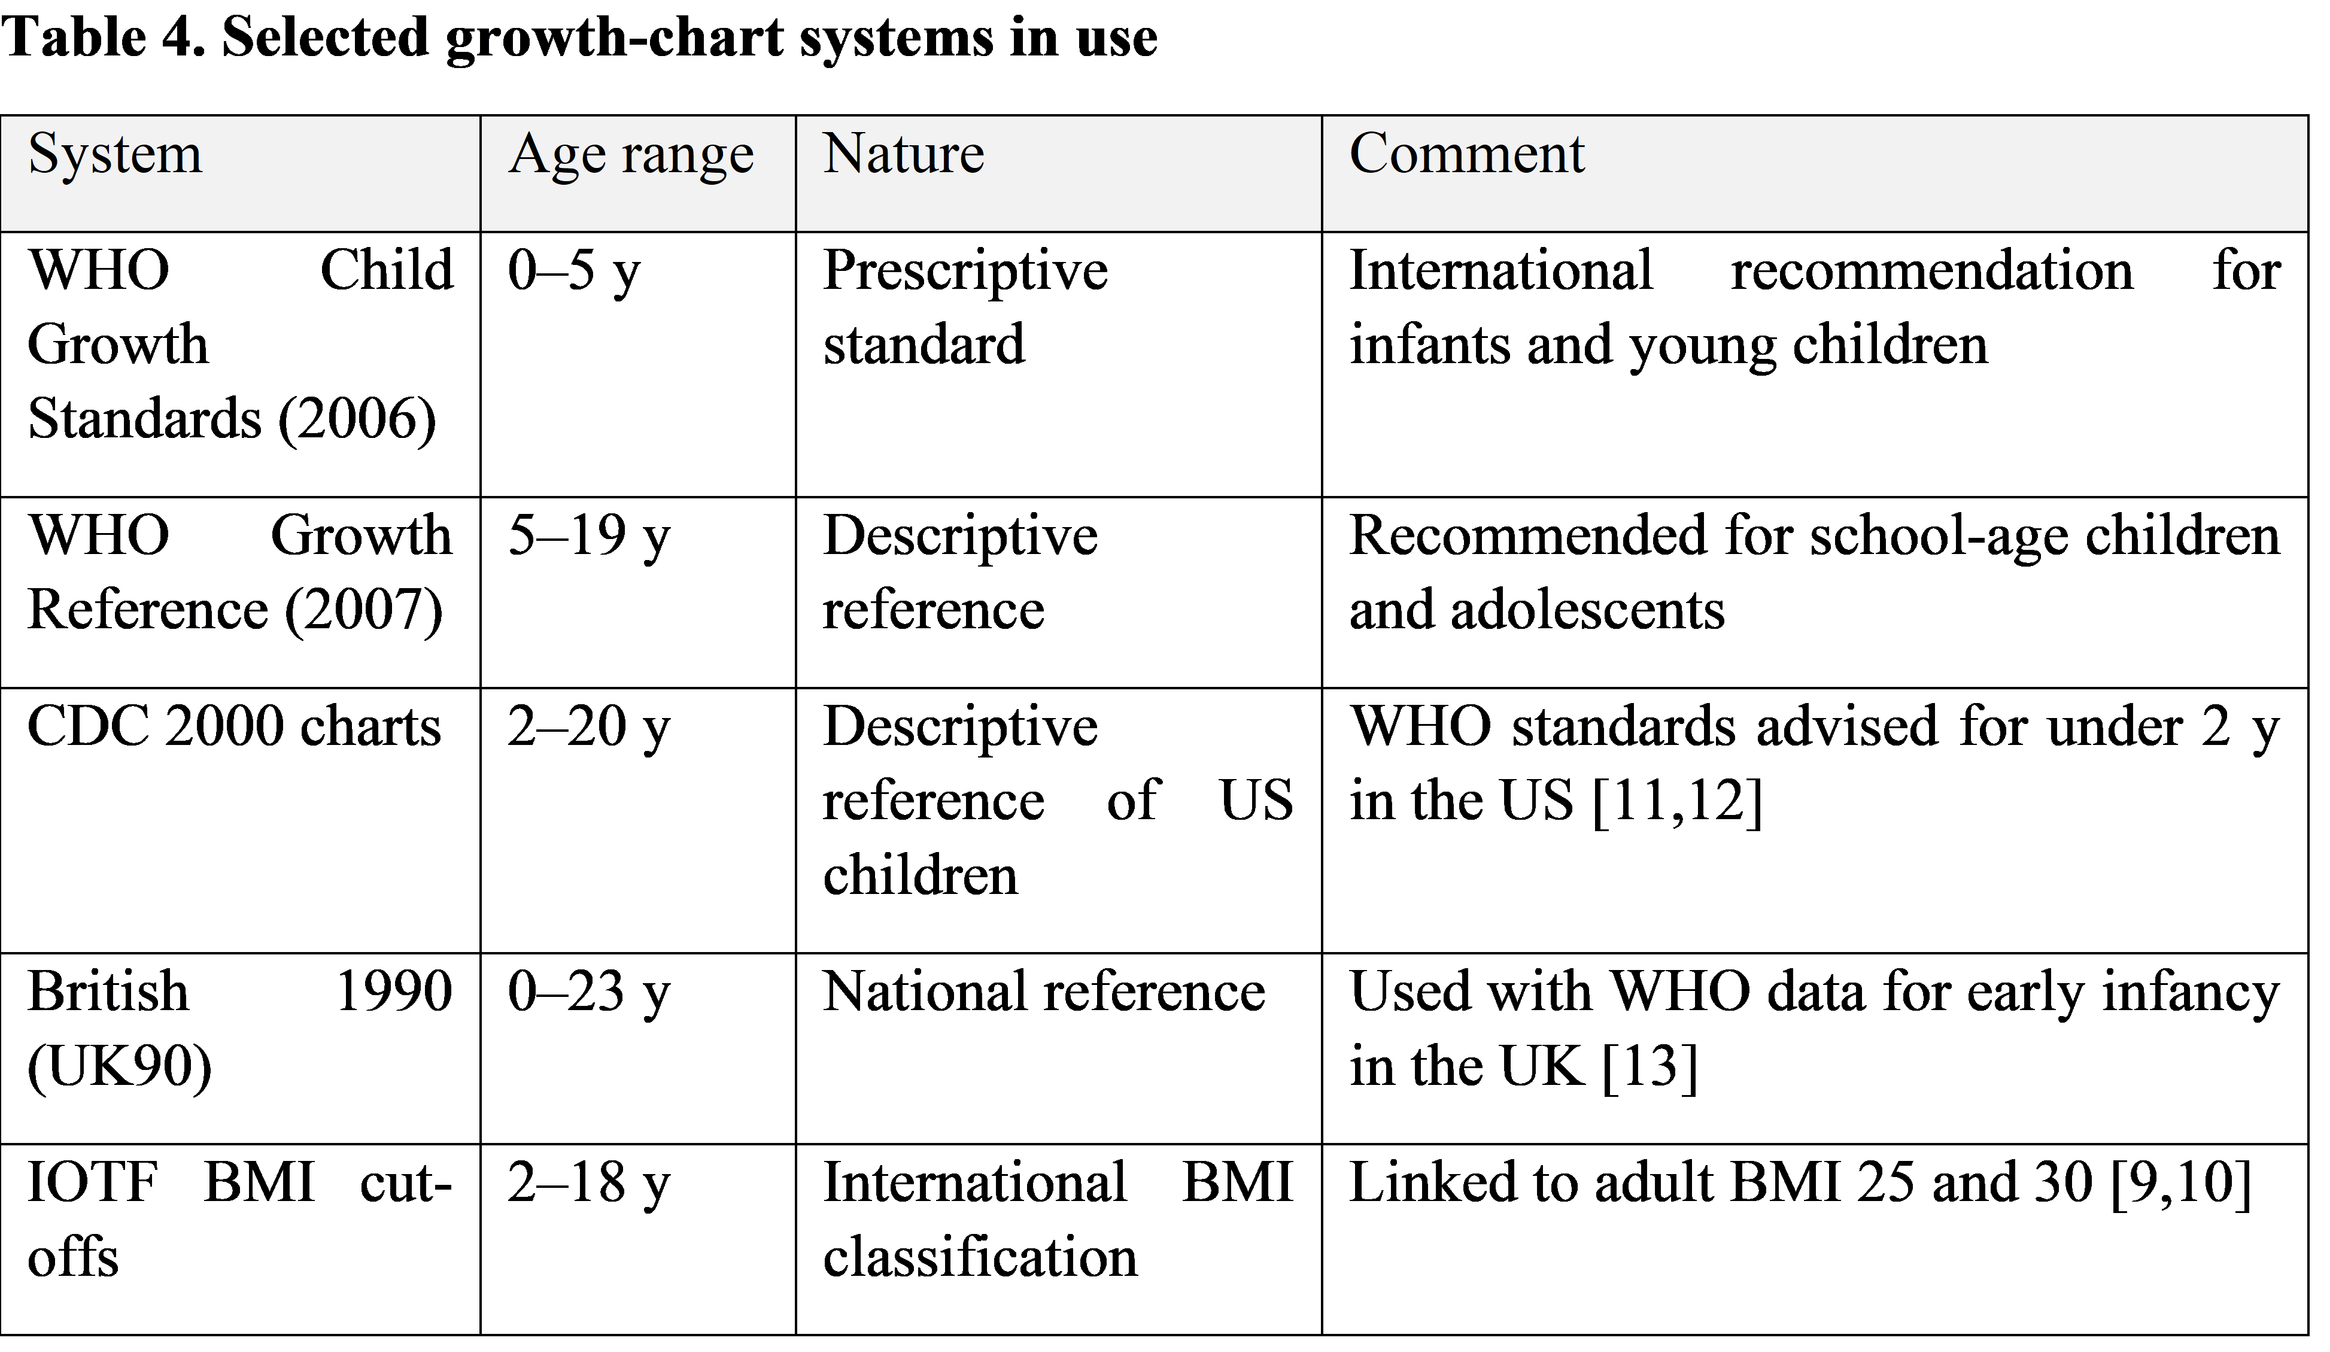
For ages 5 to 19 years, WHO uses the 2007 Growth Reference. It was reconstructed from the 1977 NCHS/WHO data set, with the addition of data from the 2006 standards to produce a smooth transition at 5 years, and with an adjustment of the BMI curves to avoid the inclusion of overweight children in the reference population [2]. This is a reference rather than a standard, because it is not based on children in ideal conditions. Using the correct tool for the correct age group matters: the 2006 Standards for birth to 5 years and the 2007 Reference for 5–19 years.
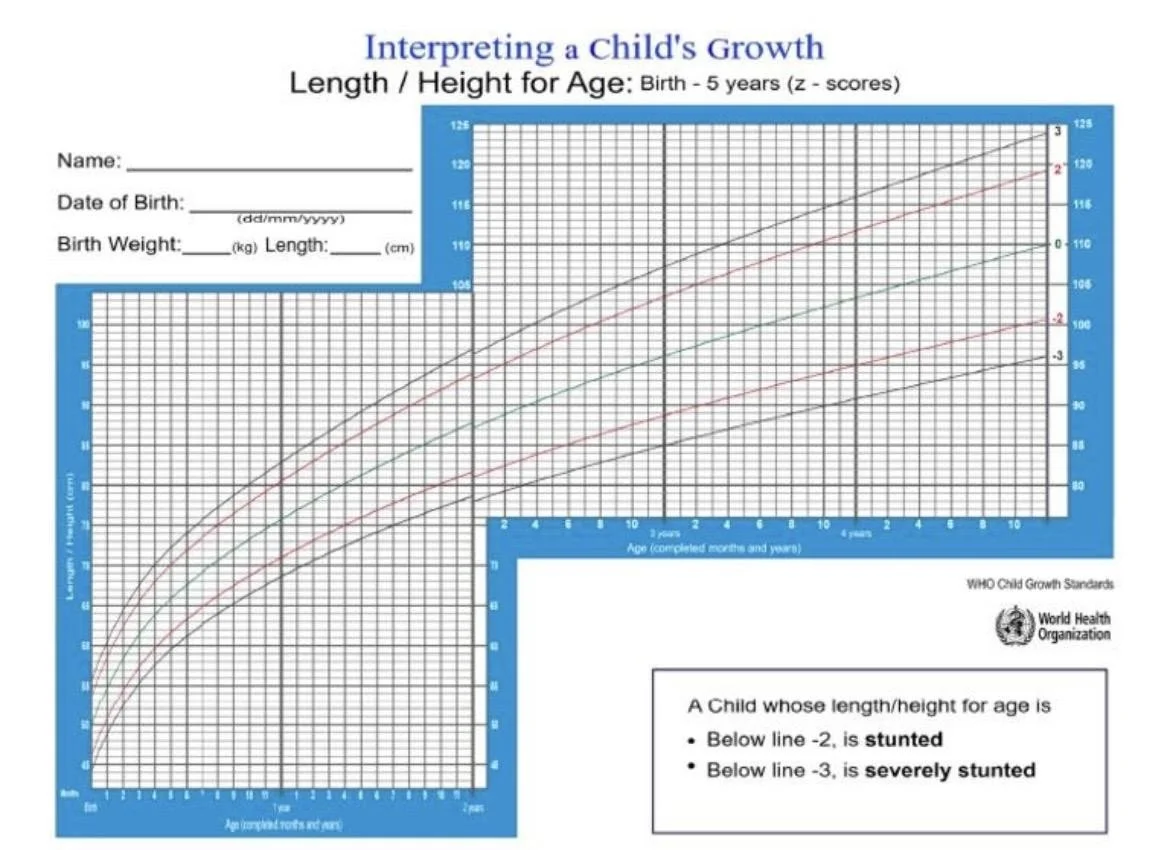
Figure 3. WHO child growth standards and growth-chart interpretation.
6.4. Weight-for-age
Weight-for-age is the oldest and most widely used indicator. It is useful for tracking the general trajectory of infants and detecting underweight, but it cannot separate a short child from a thin one, and it is not recommended on its own after about 10 years because it fails to distinguish height from fatness during puberty.
6.5. Length/height-for-age
This indicator reflects cumulative linear growth. Values below −2 z-scores define stunting, and values below −3 define severe stunting. Because height is slow to respond, a low value signals long-standing or repeated deprivation, illness or a constitutional or endocrine problem [7].
6.6. Weight-for-length/height
Weight-for-length/height describes body proportion and is the principal indicator of wasting (below −2) and severe wasting (below −3). In children under 5 a value above +2 indicates overweight and above +3 obesity. It does not require knowing the exact age, which is a practical advantage where birth dates are uncertain.
6.7. BMI-for-age
From 5 years, BMI-for-age is the preferred indicator of thinness and excess weight. WHO defines overweight as above +1 z-score and obesity as above +2, which corresponds at 19 years to adult BMI of 25 and 30 kg/m². Thinness is below −2 and severe thinness below −3 [2]. Other systems exist; the International Obesity Task Force cut-offs, for example, are linked to adult BMI at 18 years and are widely used in research [9,10].
6.8. Head circumference-for-age
Head circumference charts are used from birth to about 5 years in the WHO set, though routine measurement is most informative in the first 2 to 3 years. The chart is read together with length and weight, since a large head in a large child is not the same as a large head in a small one.
6.9. Interpretation of percentiles and z-scores
A percentile gives the proportion of the reference population that falls below the child’s value; the 50th percentile is the median. A z-score states how many standard deviations the child is above or below the median. A z-score of 0 is the median, −2 corresponds to the 2.3rd percentile, −1 to about the 16th and +2 to the 97.7th. Percentiles are intuitive for parents and for the normal range, but they compress the extremes, which is where malnutrition and obesity are found, so z-scores are preferred for children with severe deviations and for research [1,2]. WHO also defines biologically implausible values (for example, height-for-age below −6 or above +6) which usually signal a measurement or recording error and should prompt a recheck.
6.10. Clinical applications and limitations of growth charts
Growth charts are best used longitudinally, with several points per child, with correction for prematurity, and in combination with parental heights and clinical findings. Specific charts exist for conditions such as Down syndrome and Turner syndrome. The limitations are that a chart does not tell why a child is off track, that cut-offs are statistical rather than biological, and that the use of different charts can change prevalence estimates considerably [11,12].
7. Clinical Assessment of Nutritional Status in Children
7.1. Definition and importance of nutritional assessment
Nutritional assessment combines history, examination, anthropometry and, when indicated, laboratory tests. The ABCD framework (anthropometric, biochemical, clinical and dietary) is a handy reminder. The purpose is to identify malnutrition in all of its forms, undernutrition, micronutrient deficiency and overnutrition, and to decide what action is needed.
7.2. Dietary history and feeding practices
A good dietary history is more illuminating than a lengthy test. In infants it covers breastfeeding or formula, volume and frequency, timing of complementary foods and responsive feeding. In older children it covers meal patterns, diversity, snacks, sugar-sweetened beverages, fast food, vegetarian or restrictive diets, supplements and food insecurity. A 24-hour recall or a short food-frequency questionnaire gives a workable picture. It is also worth asking how mealtimes feel, since conflict at the table is common and often drives either under- or overfeeding.
7.3. Clinical examination of nutritional status
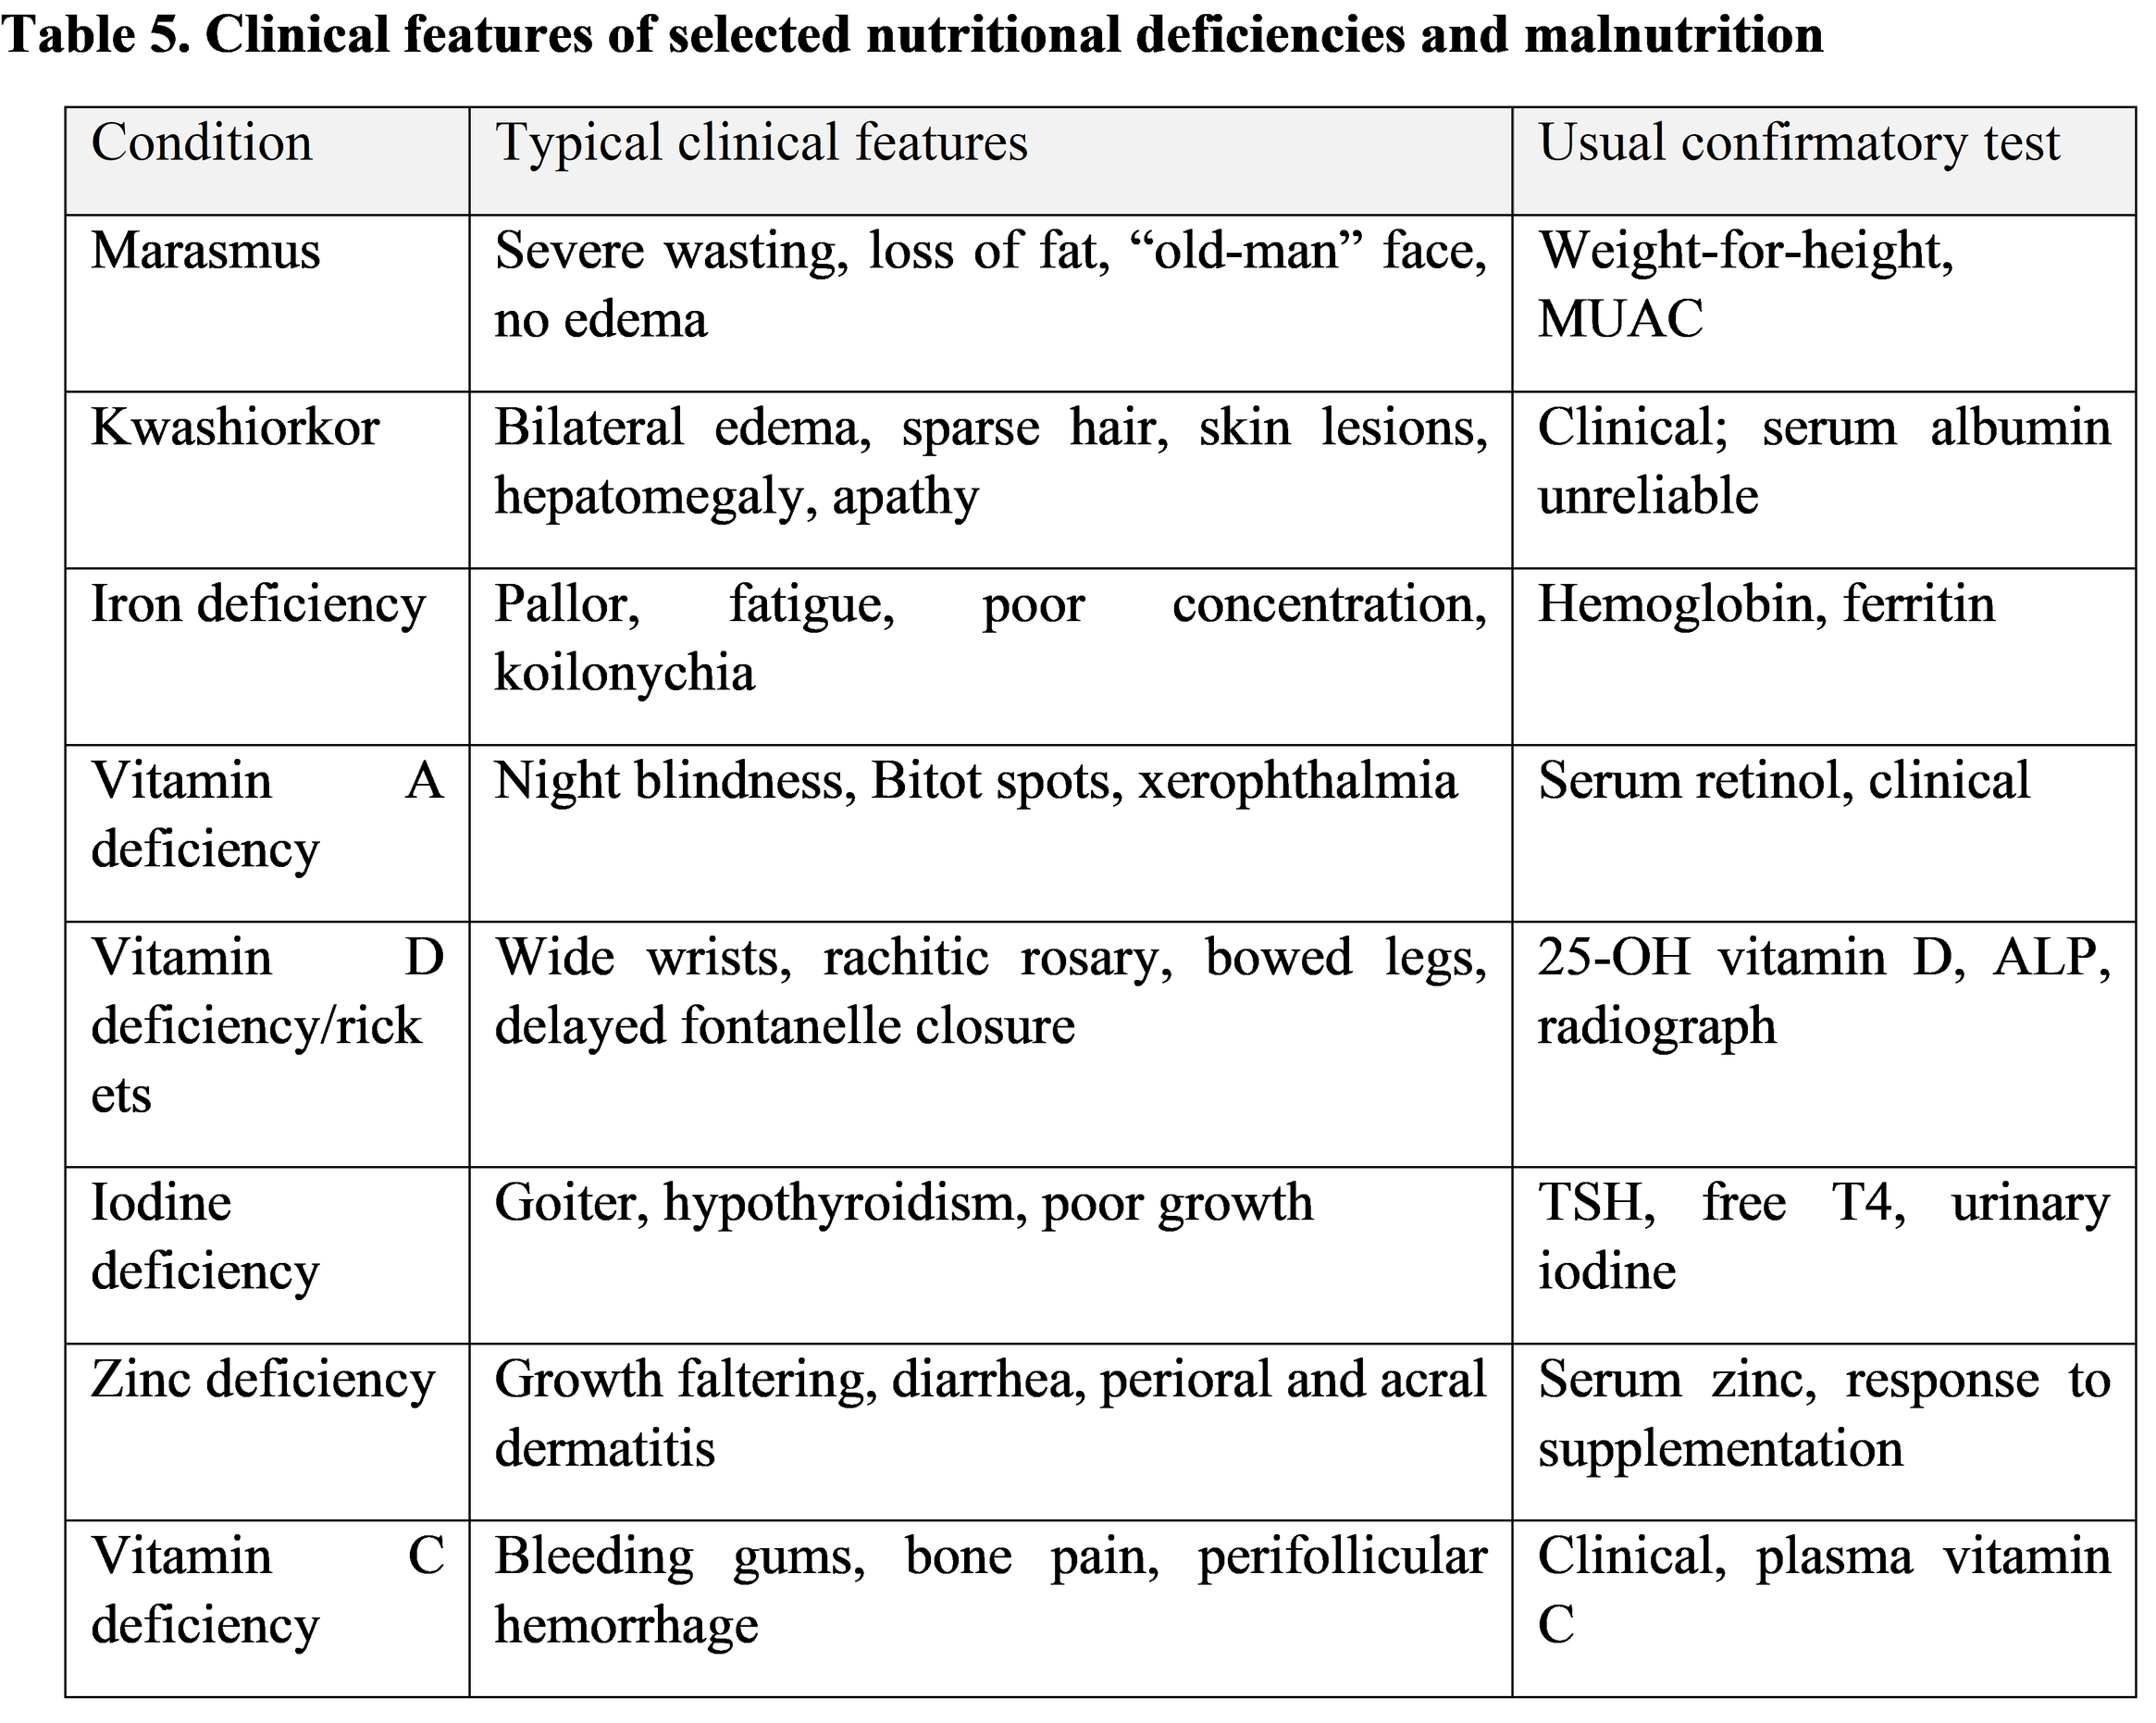
Inspect the child before touching them. Look at muscle bulk, subcutaneous fat, edema, hair, skin, nails, mouth, teeth, eyes and thyroid. Note posture, activity and mood, since apathy and irritability are common in malnourished infants. Check for pallor, signs of chronic disease, pubertal stage and body proportions (arm span, sitting height and upper-to-lower segment ratio), as disproportion suggests skeletal dysplasia or rickets rather than simple undernutrition.
7.4. Assessment of undernutrition
Undernutrition appears as stunting, wasting and underweight, which are different anthropometric problems with different causes and consequences (Table 3). Severe acute malnutrition is defined by weight-for-height below −3 z-scores, MUAC below 115 mm in children 6–59 months, or bilateral pitting edema. Clinically it presents as marasmus (severe wasting), kwashiorkor (edema, skin and hair changes) or a mixed form. These children need urgent assessment for infection, dehydration, hypoglycemia and electrolyte disturbance before any nutritional rehabilitation begins [3,16].
7.5. Assessment of overweight and obesity
Excess weight is identified from weight-for-height (under 5) or BMI-for-age (5–19), supported by waist circumference where available. Evaluation should look for comorbidities such as hypertension, dyslipidemia, fatty liver, impaired glucose regulation, obstructive sleep apnea and orthopedic or psychological problems, and should consider secondary causes (hypothyroidism, Cushing syndrome, hypothalamic and genetic syndromes), especially when obesity begins very early or is accompanied by short stature or developmental delay [22].
7.6. Clinical signs of nutritional deficiencies
7.7. Laboratory and biochemical assessment
Laboratory tests should answer a question, not substitute for the examination. In poor growth a sensible first line is a complete blood count, inflammatory markers, ferritin, electrolytes, renal and liver function, calcium, phosphate and alkaline phosphatase, thyroid function, celiac serology and urinalysis. Second-line tests, such as IGF-1, bone age, karyotype in short girls, cortisol or stimulation testing, are chosen on the basis of the clinical picture and are generally the domain of the specialist [20,21]. Serum albumin and prealbumin are influenced by inflammation and hydration and are poor stand-alone markers of nutritional status.
7.8. Integrated evaluation of anthropometric and clinical findings
No single number defines a child. A short child with normal weight-for-height and a family history of short stature is a different clinical situation from a short, thin child with chronic diarrhea. The strongest assessment is built by combining measurements, trajectory, history, examination and, only then, investigations.
8. Growth Abnormalities and Common Pediatric Growth Disorders
8.1. Definition and classification of growth disorders
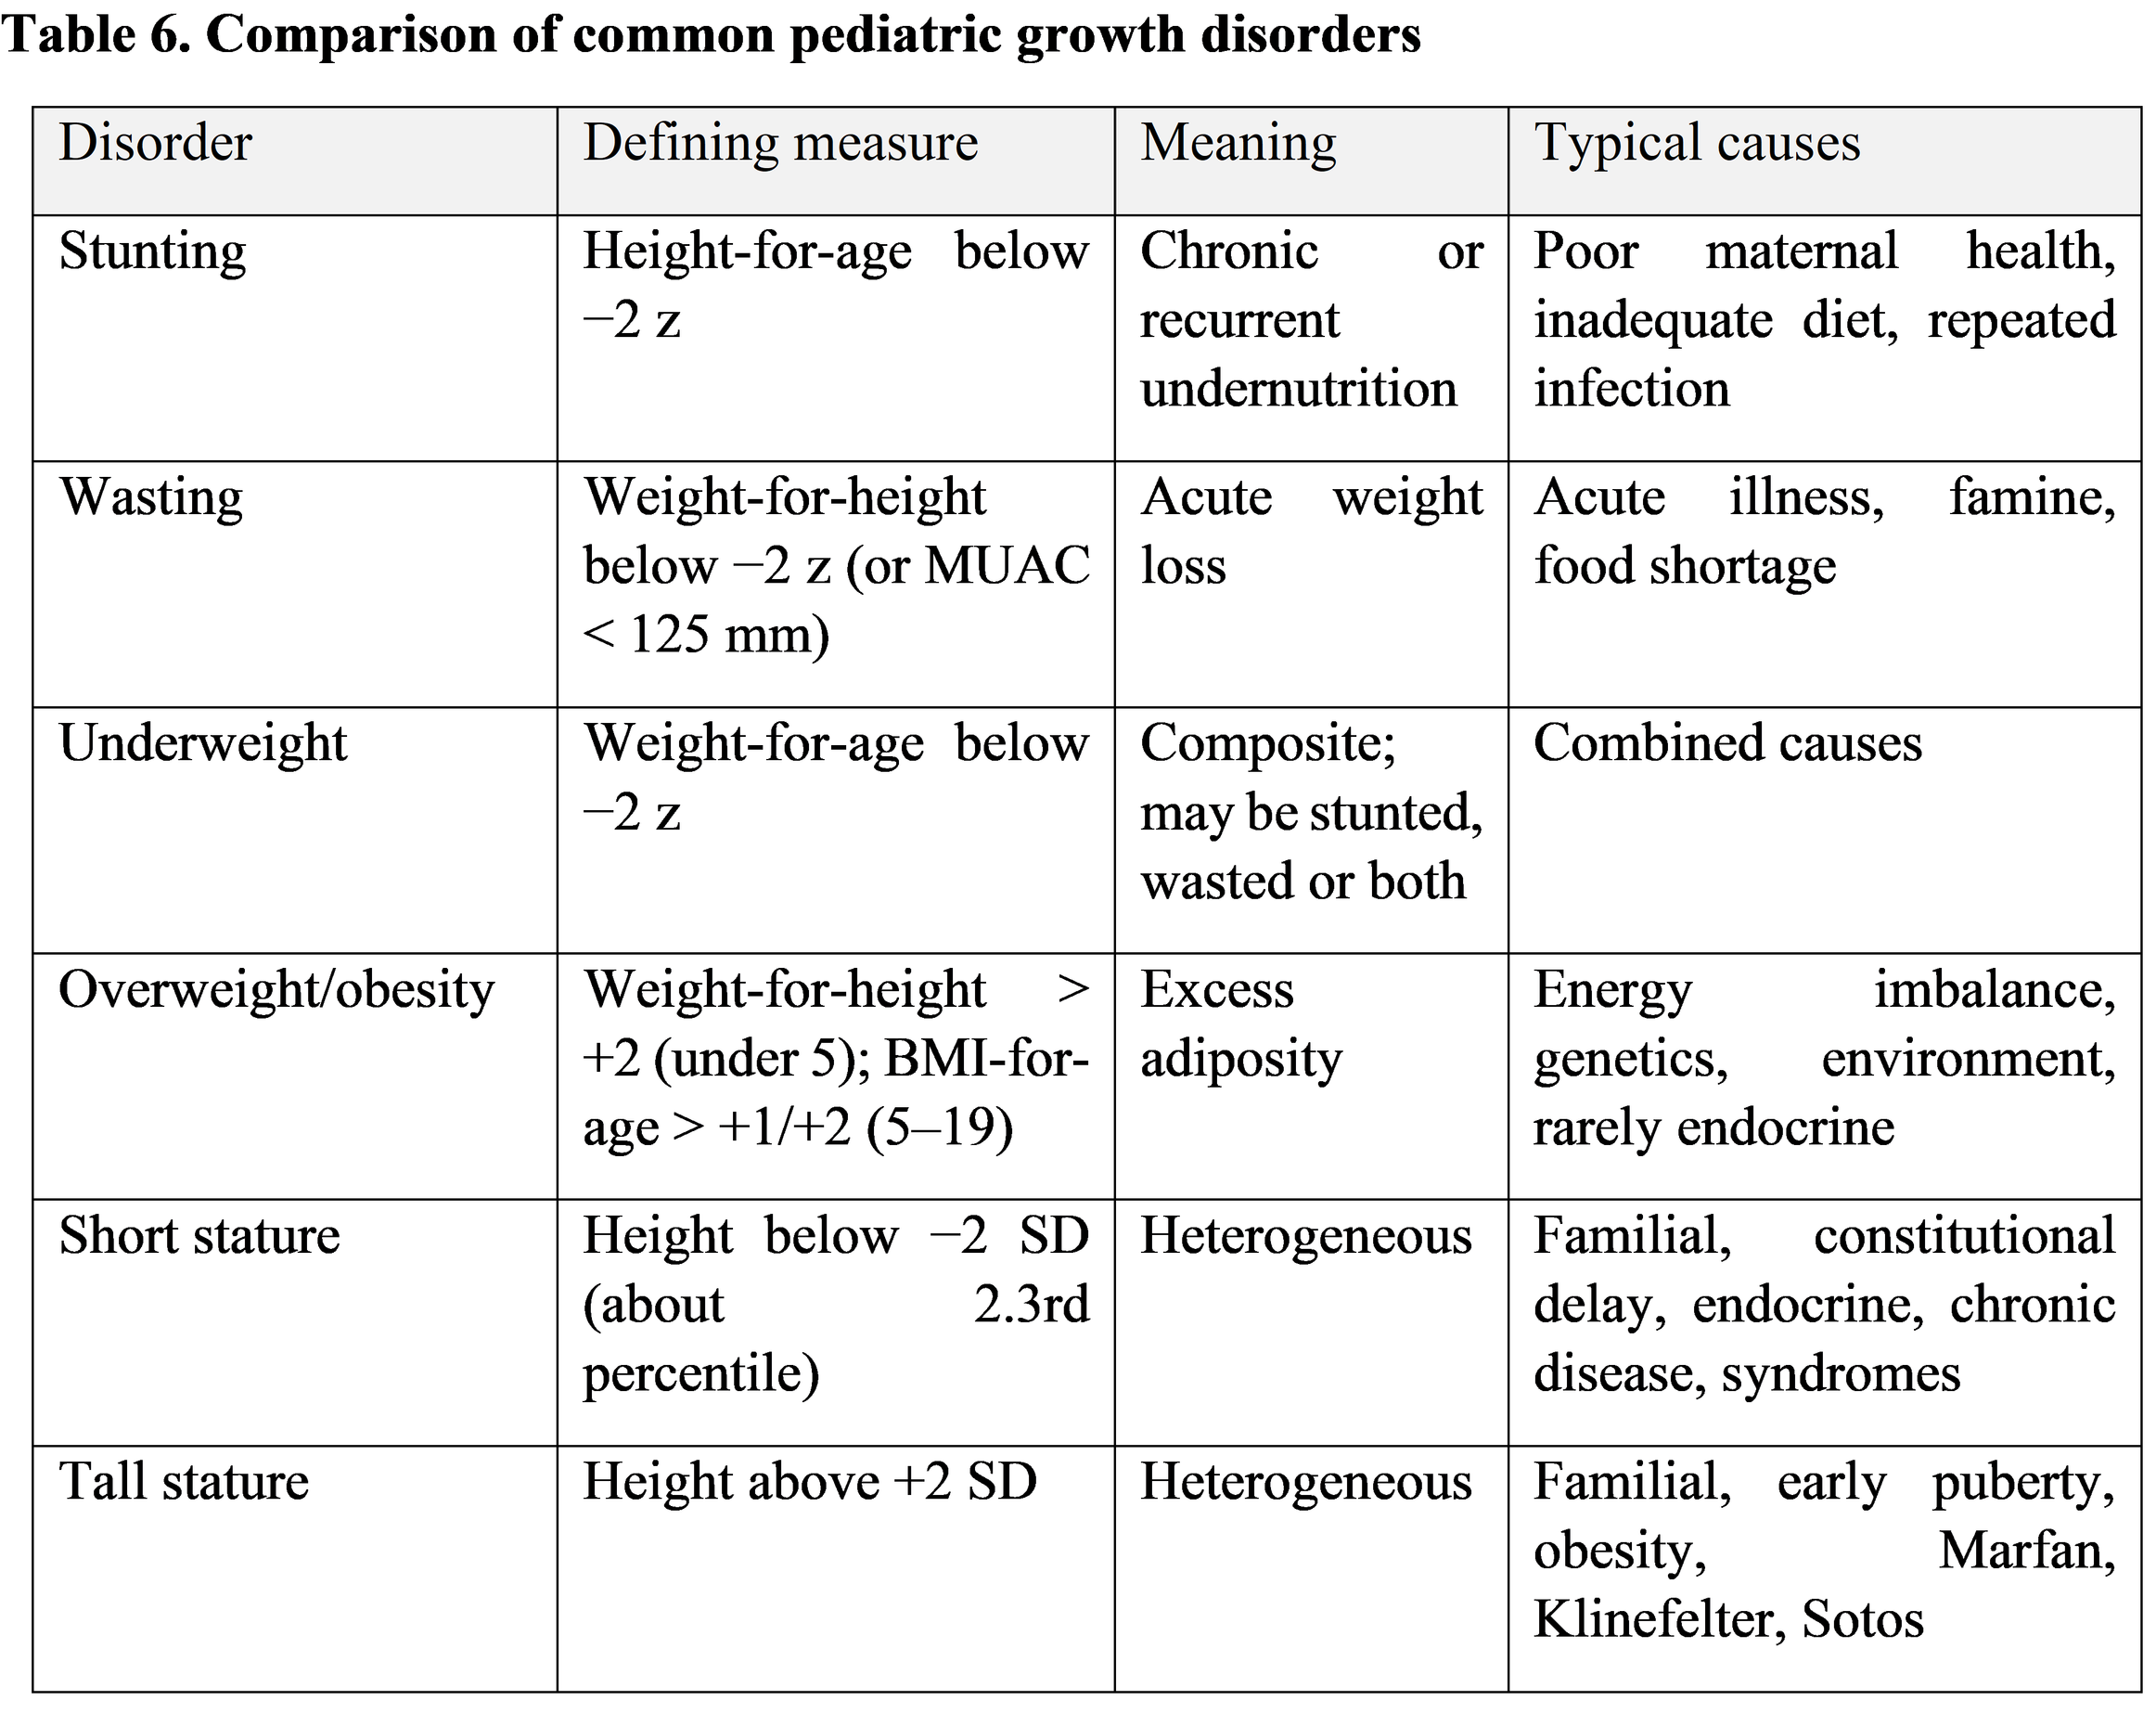
Growth disorders can be classified by the direction of deviation (too small, too large), by proportion (proportionate or disproportionate), by timing (prenatal, postnatal, pubertal) and by cause (nutritional, endocrine, genetic, chronic disease, psychosocial). The most used population indicators are stunting, wasting, underweight and overweight/obesity, which should not be confused (Table 6).
8.2. Stunting and chronic undernutrition
Stunting is the most common manifestation of chronic undernutrition worldwide. It begins in utero and in the first two years, is hard to reverse after that, and is associated with poorer cognition, school performance and adult earnings, as well as higher risk of metabolic disease in later life [4,7]. Stunting is not just a height problem; it is a marker of a hostile early environment and of damage that is often invisible.
8.3. Wasting and acute malnutrition
Wasting reflects recent, often rapid weight loss. It is closely linked to acute infection, food shortage and humanitarian crises, and it carries a high risk of death, particularly when severe [3,5]. Fortunately it can often be treated successfully with community-based management using therapeutic foods, which is one of the major advances in recent nutrition practice [6].
8.4. Underweight in children
Underweight is a composite indicator. A low weight-for-age can come from stunting, wasting or both, so on its own it tells us little about the underlying problem. It remains useful for individual monitoring in infants and for tracking international targets, but it should always be broken down by height-for-age and weight-for-height.
8.5. Overweight and childhood obesity
Childhood obesity is now one of the most important pediatric health problems of our time. The global rise has been dramatic in children aged 5–19 [8]. It tracks into adulthood and brings early complications such as type 2 diabetes, hypertension, fatty liver disease, sleep apnea and low self-esteem. Management rests on family-based behavioral change, improved diet and activity, and in selected cases pharmacological or surgical options in adolescents, guided by consensus guidelines [22].
8.6. Short stature and growth failure
Short stature is defined as height below −2 SD for age and sex. The great majority of short children have a normal variant (familial or constitutional delay) and need reassurance and follow-up. Pathological causes include growth hormone deficiency, hypothyroidism, Turner syndrome, SHOX deficiency, celiac disease, chronic kidney disease, intrauterine growth restriction without catch-up and skeletal dysplasias. Idiopathic short stature is a diagnosis of exclusion, and its treatment remains the subject of expert consensus and debate [20,21].
8.7. Tall stature and excessive growth
Most tall children are tall because their parents are. Pathological causes include precocious puberty, hyperthyroidism, growth hormone excess, Marfan syndrome, Klinefelter syndrome, Sotos syndrome and homocystinuria. Obese children are frequently tall for age in the short term but may stop growing earlier. The goal of evaluation is to find the few children with an underlying disease and to reassure the rest.
8.8. Endocrine and metabolic causes of abnormal growth
Endocrine disease is an important but relatively uncommon cause. The typical child with growth hormone deficiency is short with a slow growth velocity, a youthful appearance and relatively increased weight-for-height, while the child with hypothyroidism may also have lethargy, constipation and delayed bone age. In contrast, poor growth with obesity should raise suspicion for Cushing syndrome, hypothyroidism or growth hormone deficiency. Diagnostic confirmation requires a combination of auxology, bone age, biochemical testing and sometimes imaging or genetics [20].
8.9. Clinical importance of early identification
Early identification matters because many growth disorders respond better to treatment when recognized early. Nutritional rehabilitation, treatment of celiac disease, thyroid hormone replacement and growth hormone therapy are all more effective when started before growth potential is lost. Delay results in permanent loss of height or, in obesity, in entrenched habits and complications [3,23].
9. Growth Monitoring and Early Detection of Growth Disorders
9.1. Principles of routine growth monitoring
Monitoring means measuring regularly, plotting correctly, interpreting trends and acting on what is found. Each of these four steps can fail. Measuring without plotting wastes the effort; plotting without interpretation does not help the child; and interpretation without action is merely documentation. Monitoring is most useful when it is built into every well-child contact and when someone is clearly responsible for acting on abnormal findings.
9.2. Frequency of anthropometric assessment
Schedules differ between countries, but the principle is the same: measure more often when growth is fast. Infants are generally weighed and measured at every routine contact in the first year (often around birth, 1–2 weeks, 1, 2, 4, 6, 9 and 12 months), then every 3–6 months in the second year and at least annually thereafter, with additional measurements for any child with a concern. Children at risk, for example preterm infants, those with chronic disease or those recovering from malnutrition, need more frequent follow-up.
9.3. Identification of abnormal growth patterns
Warning patterns include a single measurement beyond ±3 z-scores; a height or weight outside the expected range for the parents; a child whose measurements are discordant, for instance a short child who is relatively heavy or a tall child who is underweight; failure to gain weight over several visits; and a head circumference that is rapidly accelerating or decelerating. Signs from the history and examination, such as dysmorphism, disproportion, chronic symptoms or social concerns, should lower the threshold for investigation.
9.4. Growth velocity and crossing of centile lines
In healthy children beyond infancy the growth curve tends to follow its centile. Crossing two major centile lines downward on the WHO charts, equivalent to a decrease of about 1.3 standard deviations, is often taken as a signal for further evaluation, and a similar upward crossing of BMI centiles suggests accelerated weight gain. Height velocity below the 25th percentile for age and sex over a year is another commonly used criterion. These rules come from consensus and have been shown to have variable sensitivity and specificity, so they should prompt a thoughtful reassessment, not automatic referral [23]. Remember the physiological exceptions, notably early infancy and the pubertal years.
9.5. Early screening and referral criteria
Referral is reasonable when height is below −2 SD or markedly discordant from the target height, when height velocity is persistently low, when there are signs of systemic disease or dysmorphism, when puberty is much earlier or later than expected, when there is severe wasting, severe obesity or obesity with suspected secondary causes, or when head size is abnormal and changing. Severe acute malnutrition, edema or MUAC below 115 mm in a young child requires urgent management [3,16].
9.6. Role of pediatricians and primary healthcare professionals
Growth monitoring is carried out mostly at the primary care level by nurses, community health workers and general pediatricians. They need training, reliable equipment, accessible charts or software, and clear referral pathways. Pediatricians have the additional task of integrating growth findings with development, family circumstances and long-term risk, and of explaining results in plain language.
9.7. Importance of parental education and follow-up
Parents are partners rather than spectators. Showing them the growth chart, explaining that crossing a line is not always bad, and giving practical advice about feeding, sleep and activity all make follow-up more likely. Many families worry about a child who is on the 10th percentile but is perfectly healthy, whereas others are not alarmed by a child who has moved from the 50th to the 90th. Careful, non-judgmental communication matters especially when discussing a child’s weight.
10. Challenges and Limitations in Pediatric Growth Assessment
10.1. Inaccurate anthropometric measurements
Measurement error is the least glamorous and most important problem. Studies of inter-observer variation show that error in height and skinfold measurements can be as large as the true change being looked for, and that systematic bias can distort prevalence figures [14,15]. Training, supervision, calibrated equipment and double measurement are the practical solutions.
10.2. Differences between growth standards and references
The use of different charts can alter the classification of the same child, for example by detecting more apparent growth faltering in breastfed infants if an older reference is used [11,12]. This is why attention to the correct chart for the child’s age and the purpose of the assessment is needed, and why national and international bodies recommend the WHO standards for early life.
10.3. Interpretation of growth variability
Normal children vary, and normal growth is not perfectly smooth. Regression to the mean, catch-up and catch-down growth, pubertal timing and measurement noise all complicate interpretation. A single abnormal point is less important than a consistent trend, and a trend in a child with a known cause, such as prematurity, should be read with the right correction.
10.4. Nutritional and socioeconomic inequalities
The burden of poor growth is not evenly distributed. Stunting and wasting are concentrated in poorer, rural and conflict-affected populations, whereas obesity is increasingly concentrated among the poor in middle- and high-income countries [3,7,8]. Those with the greatest need often have the least access to measurement and treatment, which is a failure of services as much as of individuals.
10.5. Limitations of BMI and individual anthropometric indicators
BMI does not discriminate between fat and lean mass, does not describe fat distribution, and may perform differently across ethnic groups and during puberty. Height-for-age may fail to identify the early stages of a problem, and weight-for-age conceals the distinction between stunting and wasting. The sensible response is to use indicators in combination and to supplement them with waist circumference, skinfolds or body-composition methods where needed [9,10].
10.6. Barriers to routine growth monitoring
Barriers include shortage of trained staff, lack of equipment, heavy workloads, poor record-keeping, incomplete follow-up, parental mistrust, cost and travel, and in some places cultural beliefs about what a healthy child should look like. Where monitoring is done but no action follows, its value is limited, and the screening evidence reviewed by Scherdel and colleagues highlights the lack of high-quality evidence on which strategies actually improve outcomes [23].
11. Research Gaps and Future Perspectives
11.1. Need for improved growth-screening strategies
More work is needed to define screening rules that balance sensitivity and specificity, particularly for detecting treatable conditions such as celiac disease, growth hormone deficiency and Turner syndrome without overwhelming referral services. Prospective validation of combined height and velocity criteria is a priority [23].
11.2. Digital growth monitoring and electronic health records
Electronic health records and mobile applications can calculate z-scores automatically, flag implausible values and plot trajectories, which removes much of the arithmetic burden and some of the error. Their potential is greatest in primary care and in settings with few specialists, provided that the software uses the correct references and is usable on a busy clinic day.
11.3. Artificial intelligence in pediatric growth assessment
Machine-learning approaches are being explored for the automatic detection of abnormal growth from routine data, for estimating bone age from radiographs and for measuring height and weight from photographs or smartphone sensors. Early reports are promising, but these tools need rigorous external validation, transparency about bias in the training data, and careful consideration of privacy before they are used in routine care. They should assist, not replace, clinical judgement.
11.4. Early detection of nutritional and growth disorders
Future work should concentrate on earlier identification, even before birth, through maternal nutrition, on simple community tools such as MUAC, and on integrating growth data with infection, feeding and developmental information to identify at-risk children sooner [6,7].
11.5. Future directions for pediatric clinical research
Priorities include longitudinal studies that link early growth patterns to adult outcomes, trials of interventions that address stunting and obesity together, clearer definitions of healthy catch-up growth, better body-composition measures suitable for routine use, and more diverse reference data. Greater involvement of families and communities in design and evaluation would also improve relevance and uptake.
12. Conclusion
Assessing growth and nutritional status is among the most useful skills in pediatrics. Accurate measurement, the right WHO tool for the right age, serial plotting and thoughtful interpretation make it possible to identify children with stunting, wasting, obesity, endocrine disease and chronic illness while they are still easy to help. The pitfalls are familiar: measurement error, the misuse of charts, over-reliance on single indicators and a failure to act on what the chart shows. Better training, better tools and better connections between primary care and specialist services can address most of them. Above all, growth assessment is only valuable if it is repeated, understood and followed by action for the individual child and family.
References
1. WHO Multicentre Growth Reference Study Group. (2006). WHO Child Growth Standards based on length/height, weight and age. Acta Paediatrica Supplement, 450, 76–85.
2. de Onis, M., Onyango, A. W., Borghi, E., Siyam, A., Nishida, C., & Siekmann, J. (2007). Development of a WHO growth reference for school-aged children and adolescents. Bulletin of the World Health Organization, 85(9), 660–667.
3. Black, R. E., Victora, C. G., Walker, S. P., Bhutta, Z. A., Christian, P., de Onis, M., Ezzati, M., Grantham-McGregor, S., Katz, J., Martorell, R., & Uauy, R. (2013). Maternal and child undernutrition and overweight in low-income and middle-income countries. The Lancet, 382(9890), 427–451.
4. Victora, C. G., Adair, L., Fall, C., Hallal, P. C., Martorell, R., Richter, L., & Sachdev, H. S. (2008). Maternal and child undernutrition: Consequences for adult health and human capital. The Lancet, 371(9609), 340–357.
5. Black, R. E., Allen, L. H., Bhutta, Z. A., Caulfield, L. E., de Onis, M., Ezzati, M., Mathers, C., & Rivera, J. (2008). Maternal and child undernutrition: Global and regional exposures and health consequences. The Lancet, 371(9608), 243–260.
6. Bhutta, Z. A., Das, J. K., Rizvi, A., Gaffey, M. F., Walker, N., Horton, S., Webb, P., Lartey, A., & Black, R. E. (2013). Evidence-based interventions for improvement of maternal and child nutrition: What can be done and at what cost? The Lancet, 382(9890), 452–477.
7. de Onis, M., & Branca, F. (2016). Childhood stunting: A global perspective. Maternal & Child Nutrition, 12(Suppl. 1), 12–26.
8. NCD Risk Factor Collaboration. (2017). Worldwide trends in body-mass index, underweight, overweight, and obesity from 1975 to 2016: A pooled analysis of 2416 population-based measurement studies in 128.9 million children, adolescents, and adults. The Lancet, 390(10113), 2627–2642.
9. Cole, T. J., Bellizzi, M. C., Flegal, K. M., & Dietz, W. H. (2000). Establishing a standard definition for child overweight and obesity worldwide: International survey. BMJ, 320(7244), 1240–1243.
10. Cole, T. J., & Lobstein, T. (2012). Extended international (IOTF) body mass index cut-offs for thinness, overweight and obesity. Pediatric Obesity, 7(4), 284–294.
11. Kuczmarski, R. J., Ogden, C. L., Guo, S. S., Grummer-Strawn, L. M., Flegal, K. M., Mei, Z., Wei, R., Curtin, L. R., Roche, A. F., & Johnson, C. L. (2002). 2000 CDC growth charts for the United States: Methods and development. National Center for Health Statistics.
12. Grummer-Strawn, L. M., Reinold, C., & Krebs, N. F. (2010). Use of World Health Organization and CDC growth charts for children aged 0–59 months in the United States. MMWR Recommendations and Reports, 59(RR-9), 1–15.
13. Cole, T. J., Freeman, J. V., & Preece, M. A. (1998). British 1990 growth reference centiles for weight, height, body mass index and head circumference fitted by maximum penalized likelihood. Statistics in Medicine, 17(4), 407–429.
14. Ulijaszek, S. J., & Kerr, D. A. (1999). Anthropometric measurement error and the assessment of nutritional status. British Journal of Nutrition, 82(3), 165–177.
15. de Onis, M., Onyango, A. W., Van den Broeck, J., Chumlea, W. C., & Martorell, R. (2004). Measurement and standardization protocols for anthropometry used in the construction of a new international growth reference. Food and Nutrition Bulletin, 25(1 Suppl.), S27–S36.
16. Myatt, M., Khara, T., & Collins, S. (2006). A review of methods to detect cases of severely malnourished children in the community for their admission into community-based therapeutic care programs. Food and Nutrition Bulletin, 27(3 Suppl.), S7–S23.
17. Gluckman, P. D., Hanson, M. A., Cooper, C., & Thornburg, K. L. (2008). Effect of in utero and early-life conditions on adult health and disease. The New England Journal of Medicine, 359(1), 61–73.
18. Silventoinen, K. (2003). Determinants of variation in adult body height. Journal of Biosocial Science, 35(2), 263–285.
19. Wood, A. R., Esko, T., Yang, J., Vedantam, S., Pers, T. H., Gustafsson, S., Chu, A. Y., Estrada, K., Luan, J., Kutalik, Z., Amin, N., Buchkovich, M. L., Croteau-Chonka, D. C., Day, F. R., Duan, Y., Fall, T., Fehrmann, R., Ferreira, T., Jackson, A. U., … Frayling, T. M. (2014). Defining the role of common variation in the genomic and biological architecture of adult human height. Nature Genetics, 46(11), 1173–1186.
20. Grimberg, A., DiVall, S. A., Polychronakos, C., Allen, D. B., Cohen, L. E., Quintos, J. B., Rossi, W. C., Feudtner, C., & Murad, M. H. (2016). Guidelines for growth hormone and insulin-like growth factor-I treatment in children and adolescents: Growth hormone deficiency, idiopathic short stature, and primary IGF-I deficiency. Hormone Research in Paediatrics, 86(6), 361–397.
21. Cohen, P., Rogol, A. D., Deal, C. L., Saenger, P., Reiter, E. O., Ross, J. L., Chernausek, S. D., Savage, M. O., & Wit, J. M. (2008). Consensus statement on the diagnosis and treatment of children with idiopathic short stature: A summary of the Growth Hormone Research Society, the Lawson Wilkins Pediatric Endocrine Society, and the European Society for Paediatric Endocrinology Workshop. The Journal of Clinical Endocrinology & Metabolism, 93(11), 4210–4217.
22. Styne, D. M., Arslanian, S. A., Connor, E. L., Farooqi, I. S., Murad, M. H., Silverstein, J. H., & Yanovski, J. A. (2017). Pediatric obesity—Assessment, treatment, and prevention: An Endocrine Society clinical practice guideline. The Journal of Clinical Endocrinology & Metabolism, 102(3), 709–757.
23. Scherdel, P., Dunkel, L., van Dommelen, P., Goulet, O., Salaün, J.-F., Brauner, R., Heude, B., & Chalumeau, M. (2016). Growth monitoring as an early detection tool: A systematic review. The Lancet Diabetes & Endocrinology, 4(5), 447–456.
24. Tanner, J. M., & Whitehouse, R. H. (1976). Clinical longitudinal standards for height, weight, height velocity, weight velocity, and stages of puberty. Archives of Disease in Childhood, 51(3), 170–179.
25. WHO Multicentre Growth Reference Study Group. (2006). Assessment of differences in linear growth among populations in the WHO Multicentre Growth Reference Study. Acta Paediatrica Supplement, 450.