
Faltering Growth in Children: Early Identification, Clinical Assessment, Anthropometric Indicators and Evidence-Based Management
1. Altynai Nuralieva
2. Thangadurai Chitra Yasvanth
(1. Lecturer, International Medical Faculty, Osh State University, Osh, Kyrgyz Republic
2. Student, International Medical Faculty, Osh State University, Osh, Kyrgyz Republic.)
Abstract
Background. Poor growth in early life is one of the most common reasons a child is brought to a paediatric clinic, and one of the most inconsistently handled. For decades the label "failure to thrive" was applied without a shared definition, which meant delayed recognition for some children and unnecessary investigation for others. In March 2026 the American Academy of Pediatrics (AAP) and the North American Society for Pediatric Gastroenterology, Hepatology and Nutrition (NASPGHAN) issued a joint guideline that replaces that label with "faltering weight" and sets z-score-based diagnostic criteria [1].
Aim. To review how faltering growth is defined, recognised, assessed and treated, to separate faltering weight from impaired linear growth, stunting and wasting, and to identify gaps in growth-monitoring practice, especially in resource-limited settings.
Methods. Narrative review, structured with reference to the SANRA scale. Planned search of PubMed/MEDLINE, Embase, Scopus and the Cochrane Library for 2016–2026, plus foundational studies and guidance from the WHO, AAP and NASPGHAN.
Findings. Z-scores and growth velocity identify faltering weight more objectively than percentile crossing. Careful history, accurate measurement and a feeding assessment are the core of the evaluation; routine laboratory screening has low yield. Management centres on increasing energy intake, supporting responsive feeding and treating any underlying disease, delivered by a multidisciplinary team. Weight-based criteria should not be applied to stunting or other linear growth problems.Early, accurate measurement and a proportionate work-up improve care. The largest unresolved problem is implementation: reliable equipment, trained staff and serial measurement are still missing in many health systems.
Keywords: faltering growth; faltering weight; child development; anthropometry; growth monitoring; malnutrition; nutritional assessment; paediatrics
1. Introduction
A child's growth is, in a quiet way, a running commentary on their health. Weight and length are measured at almost every early contact with the health system, and the numbers are read as a summary of nutrition, illness, home environment and development all at once. When the line on the chart flattens or drifts downward, something is usually worth looking into.The difficulty is deciding what "something" means. Children grow at different rates, small parents often have small children, and a single low reading may be nothing more than a poorly calibrated scale. Yet a genuine growth problem in the first years of life is not trivial: this is the period of fastest brain growth, and nutritional shortfalls here can leave marks that last well beyond childhood.Three terms are often used as though they were interchangeable, and they are not. Faltering growth is the broad clinical concept of a child whose growth is falling short of expectation. Faltering weight is a specific, now formally defined state in which weight gain is inadequate relative to length or age. Childhood malnutrition is a wider nutritional diagnosis that includes wasting, stunting, micronutrient deficiency and overweight. A child can have one without the others, and the investigation and treatment differ accordingly.Globally, undernutrition remains a major contributor to child illness and death, and its effects on schooling and adult productivity are well documented [5]. In high-income countries the picture is different, with faltering weight more often tied to feeding difficulties, chronic illness and social circumstances than to absolute food scarcity. Both settings share a problem: delayed identification. A child whose faltering is recognised late has already lost months of catch-up opportunity.This review has three aims. First, to set out what normal growth looks like and how faltering is defined today. Second, to walk through assessment and management in a way that is practical for paediatricians, general practitioners and trainees. Third, to be honest about where the evidence is thin, particularly regarding monitoring in settings with limited resources.
2. Physiology of Normal Growth and Development
2.1 Biological basis
Growth is the net result of cell multiplication, cell enlargement and the laying down of tissue, and it depends on a steady supply of energy, protein and micronutrients. Several hormonal systems coordinate it. Growth hormone, released from the pituitary, acts largely through insulin-like growth factor 1 (IGF-1), produced mainly in the liver, to drive linear growth. Thyroid hormones are necessary for normal skeletal maturation and brain development; a child with untreated hypothyroidism can grow slowly even when well fed. Insulin is an important anabolic signal, particularly in infancy. Genetic potential sets the ceiling, and nutrition and health determine how close a child gets to it.
2.2 Stages of growth
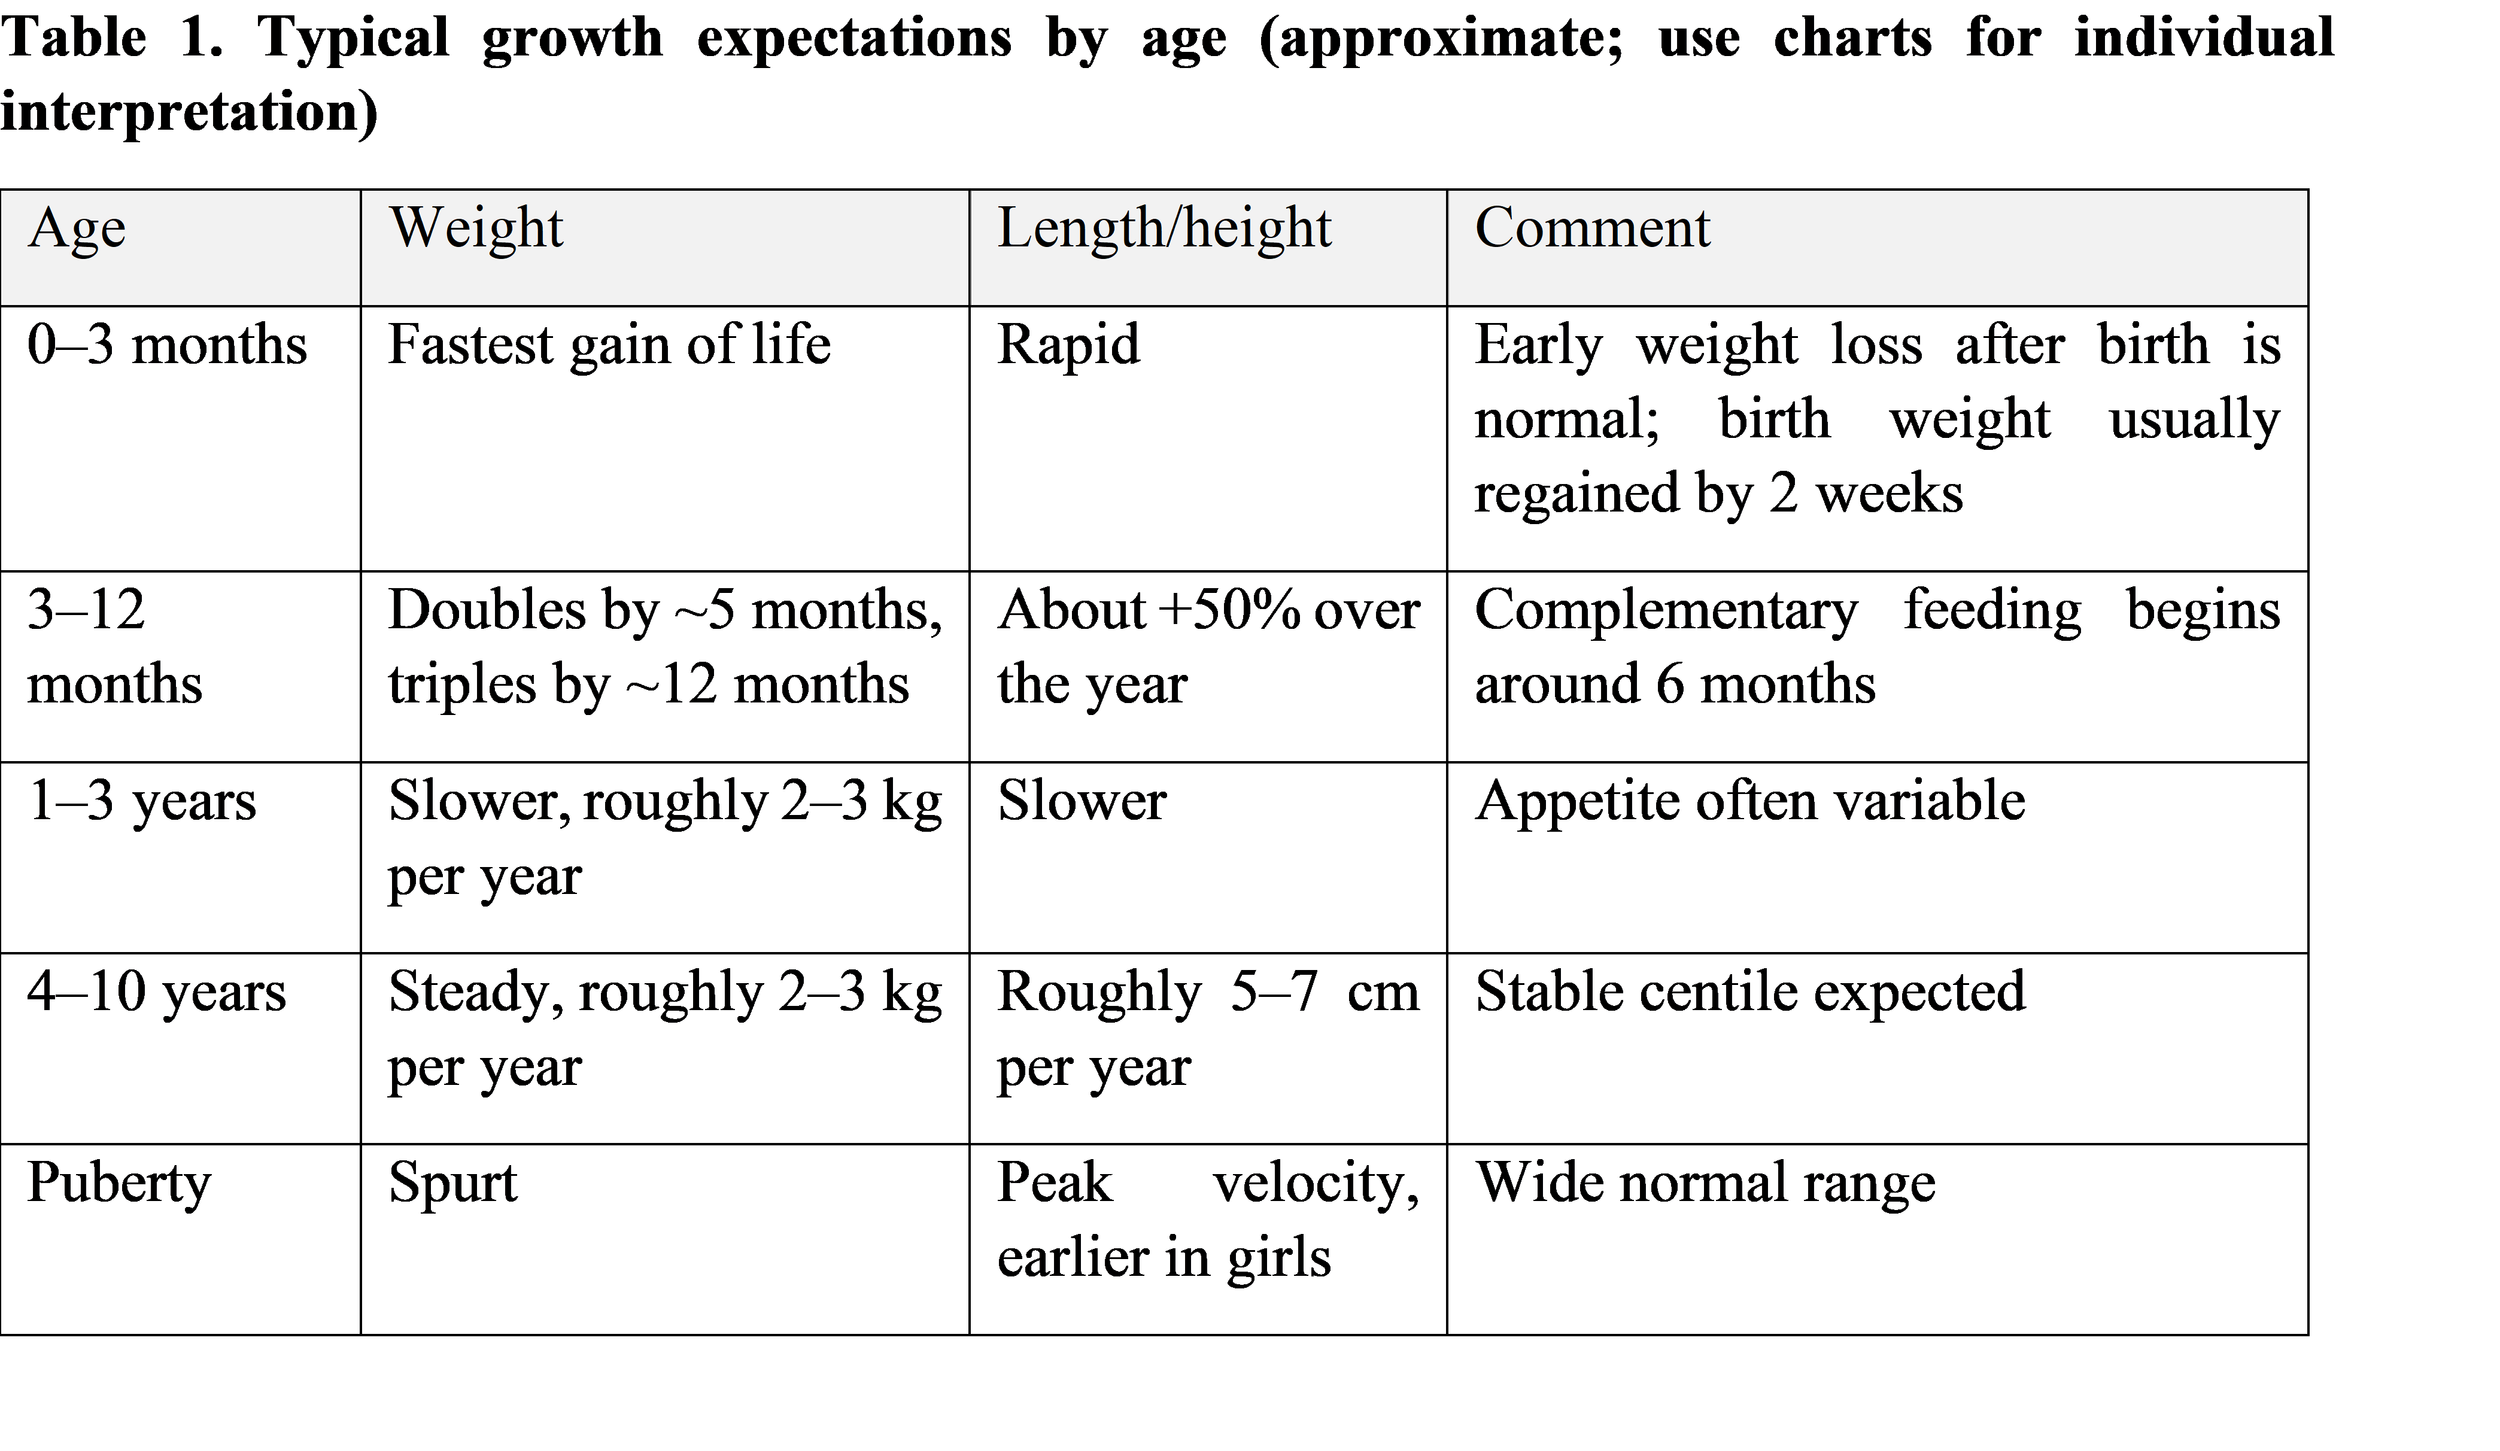
Growth does not proceed at a steady rate. Infancy is the period of most rapid change: birth weight roughly doubles by about five months and triples by the first birthday, and length increases by around half again in the first year. Growth then slows through early childhood, with the toddler years often marked by a physiological fall in appetite that worries parents more than it should. Middle childhood is a period of steady, modest gains. Adolescence brings the pubertal growth spurt, with timing differing between girls and boys and varying widely between individuals.
2.3 Influences on growth
Genetic background accounts for a large share of the variation between children, which is why parental height always belongs in the history. Nutrition is the most modifiable factor. Endocrine disease, chronic illness (cardiac, renal, respiratory, gastrointestinal) and repeated infection all interfere with growth, as do environmental and socioeconomic conditions such as food insecurity, crowding and limited access to care. In practice these factors rarely act alone.
3. Understanding Faltering Growth
3.1 From "failure to thrive" to "faltering weight"
For many years, "failure to thrive" described children whose weight fell below a chosen percentile or who crossed major percentile lines. Different authors used different thresholds, and clinicians used different words (poor weight gain, growth faltering, failure to thrive) for what might be the same child. The phrase also carried an unintended sense of blame towards caregivers, which can damage the relationship with families at precisely the moment when their cooperation matters most.
The 2026 AAP/NASPGHAN guideline, published in Pediatrics [1], addresses both problems. It replaces "failure to thrive" with "faltering weight" and uses z-score cutoffs rather than percentiles. Under the guideline, faltering weight is diagnosed when any one of the following is present:
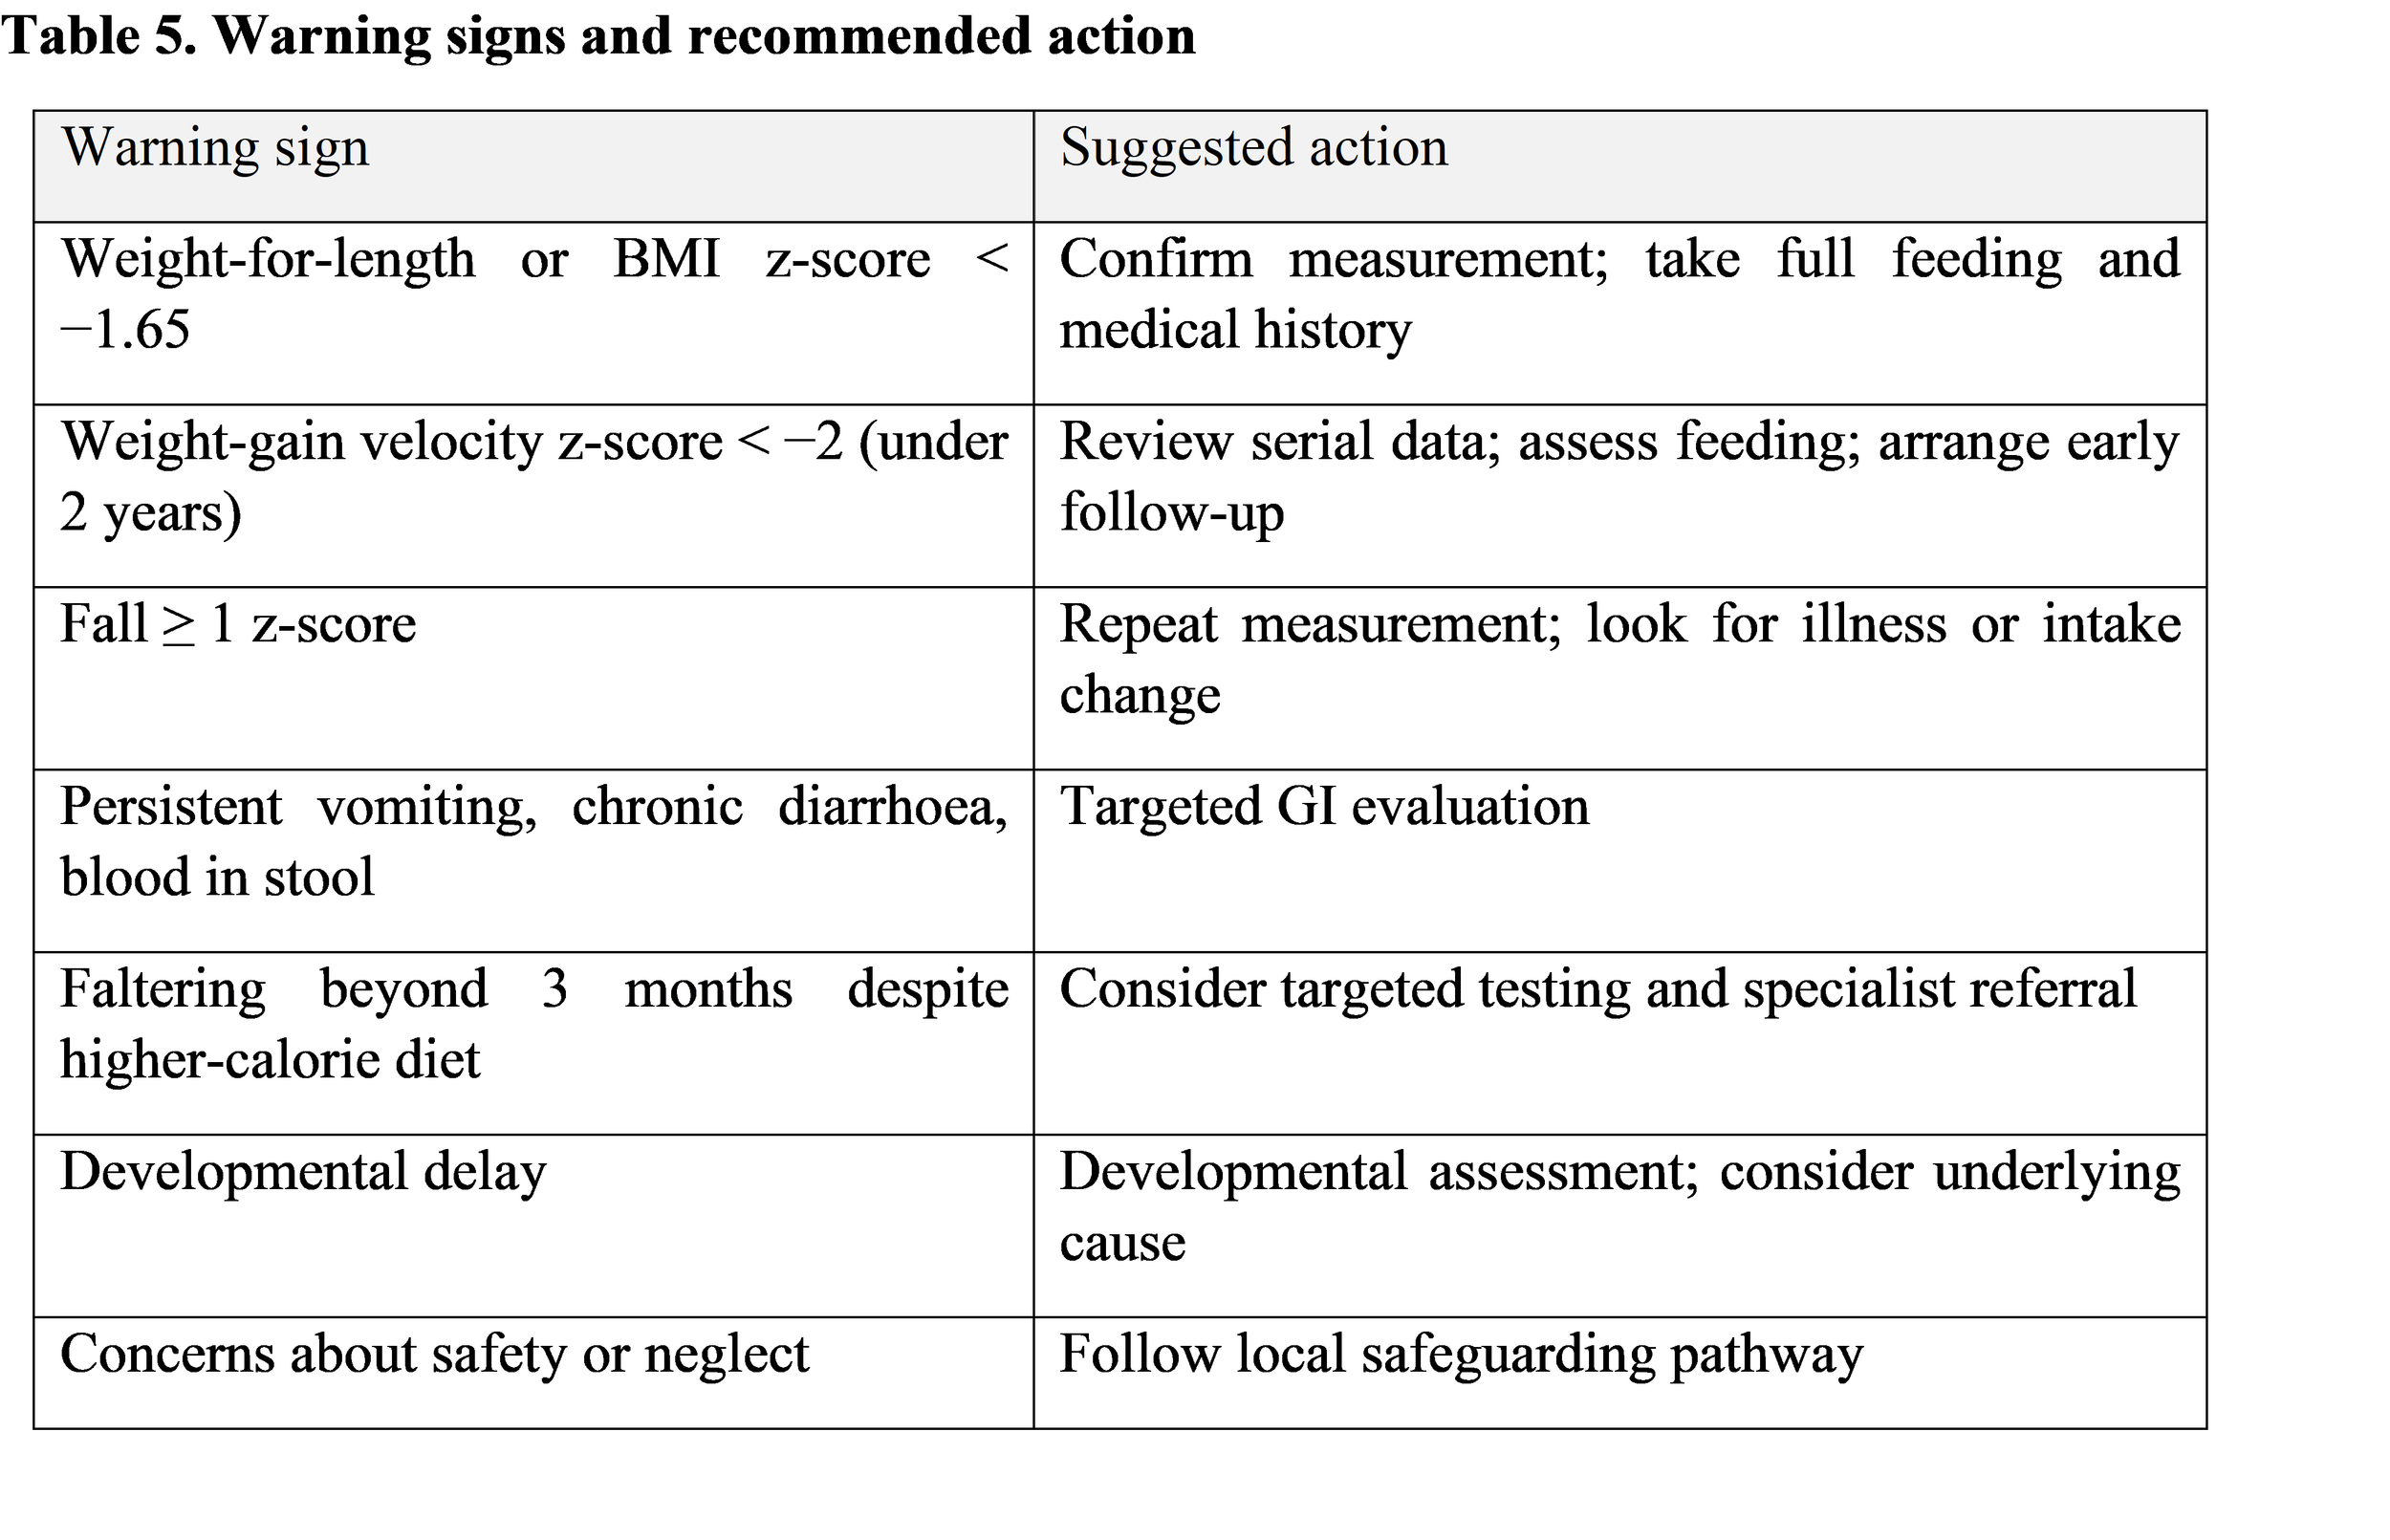
• weight-for-length or BMI-for-age below −1.65 z-score (about the 5th percentile);
• weight-gain velocity below −2 z-score for age, in children younger than 2 years;
• a decline of 1 z-score or more in weight, weight-for-length or BMI.
The guideline is directed at children aged 0 to 5 years [1]. It also defines persistent faltering weight as faltering that continues beyond three months despite initial treatment with higher-calorie foods, which is the point at which wider diagnostic testing becomes reasonable. It further states that socioeconomic status should not itself be used as a diagnostic criterion, although clinicians should still screen for social drivers of health and connect families with support [1].
3.2 A necessary distinction
It would be a mistake to treat faltering weight as a synonym for every growth disorder. The AAP/NASPGHAN criteria are weight-based. They do not describe a child who is short but proportionate, a child with stunting from chronic undernutrition, or a child with a primary endocrine cause of poor height gain. Those conditions need length- or height-based assessment and, often, a different work-up. This review therefore keeps the patterns separate.
3.2.1 Patterns of faltering
• Weight faltering: inadequate weight gain relative to expectation, usually the first sign of insufficient energy intake or excess loss or expenditure.
• Wasting: low weight-for-length/height; often reflects recent or acute deficit.
• Stunting: low length/height-for-age; reflects chronic or repeated deficit, and is the dominant form of undernutrition worldwide.
• Linear growth restriction: slow height velocity, which should prompt consideration of endocrine, skeletal, genetic and chronic systemic causes.
• Combined patterns: weight and height both affected, typical of prolonged and severe nutritional or disease burden.
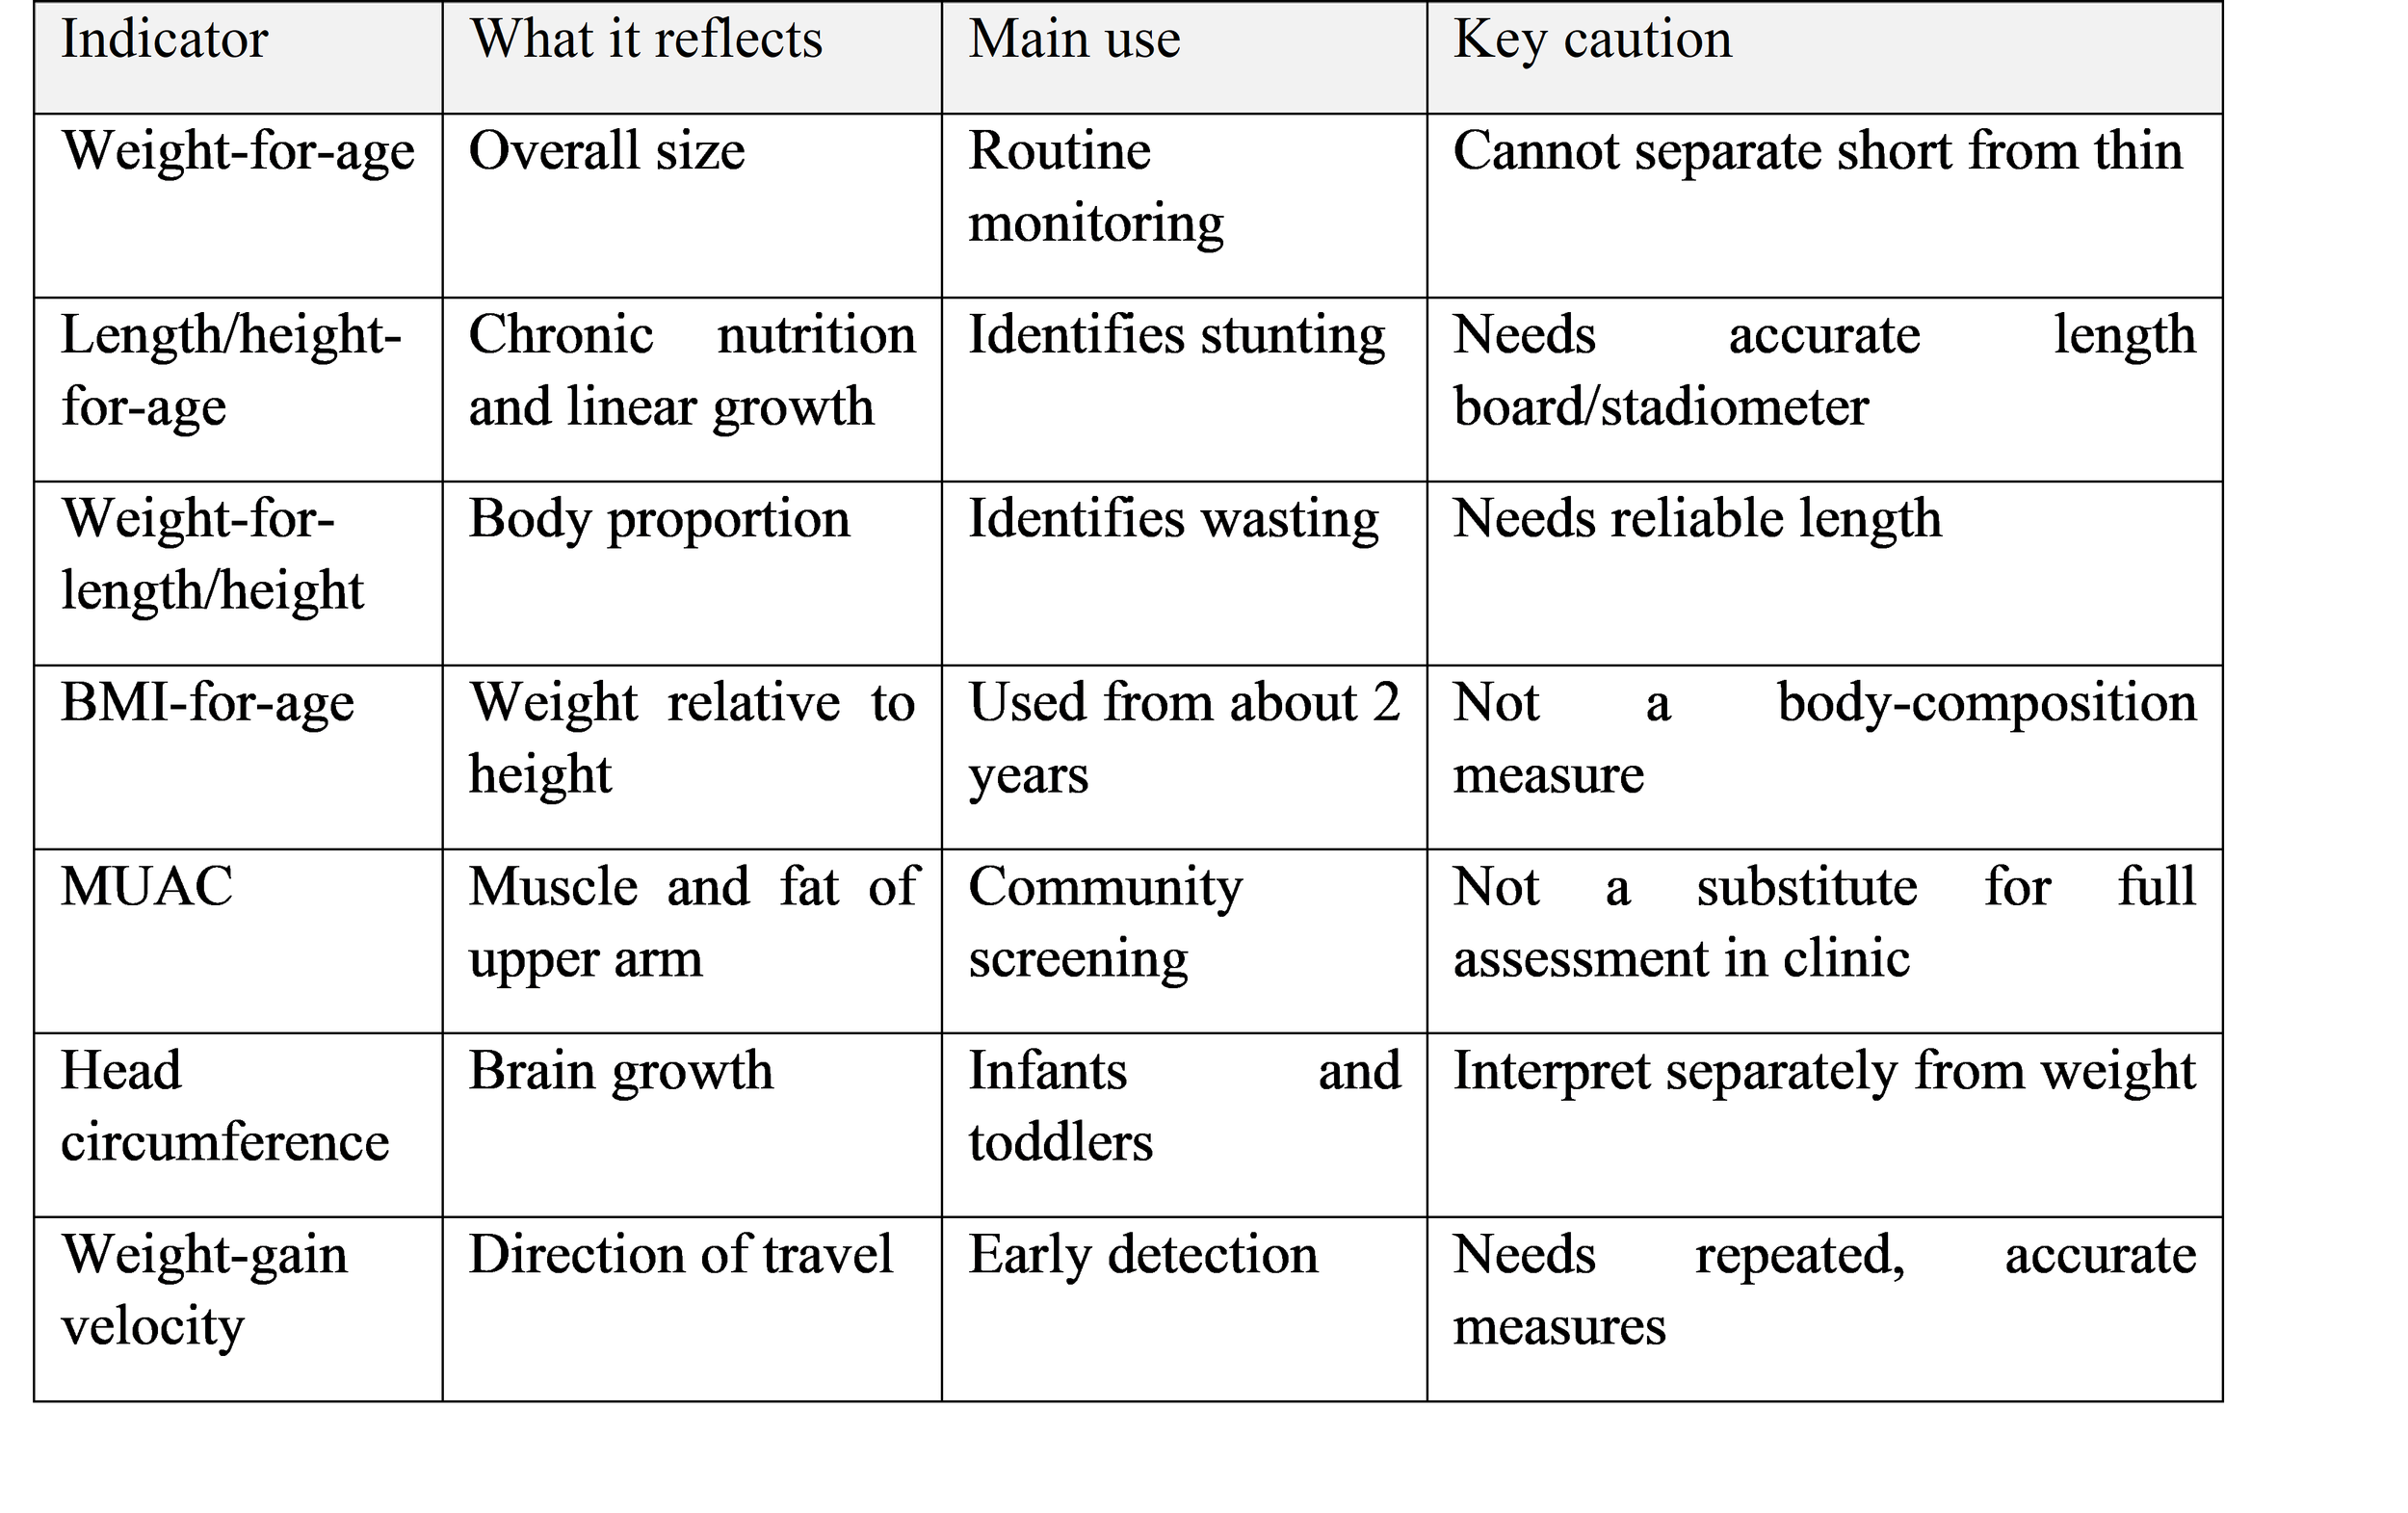
Table 2. Anthropometric indicators and what they tell us
4. Causes and Risk Factors
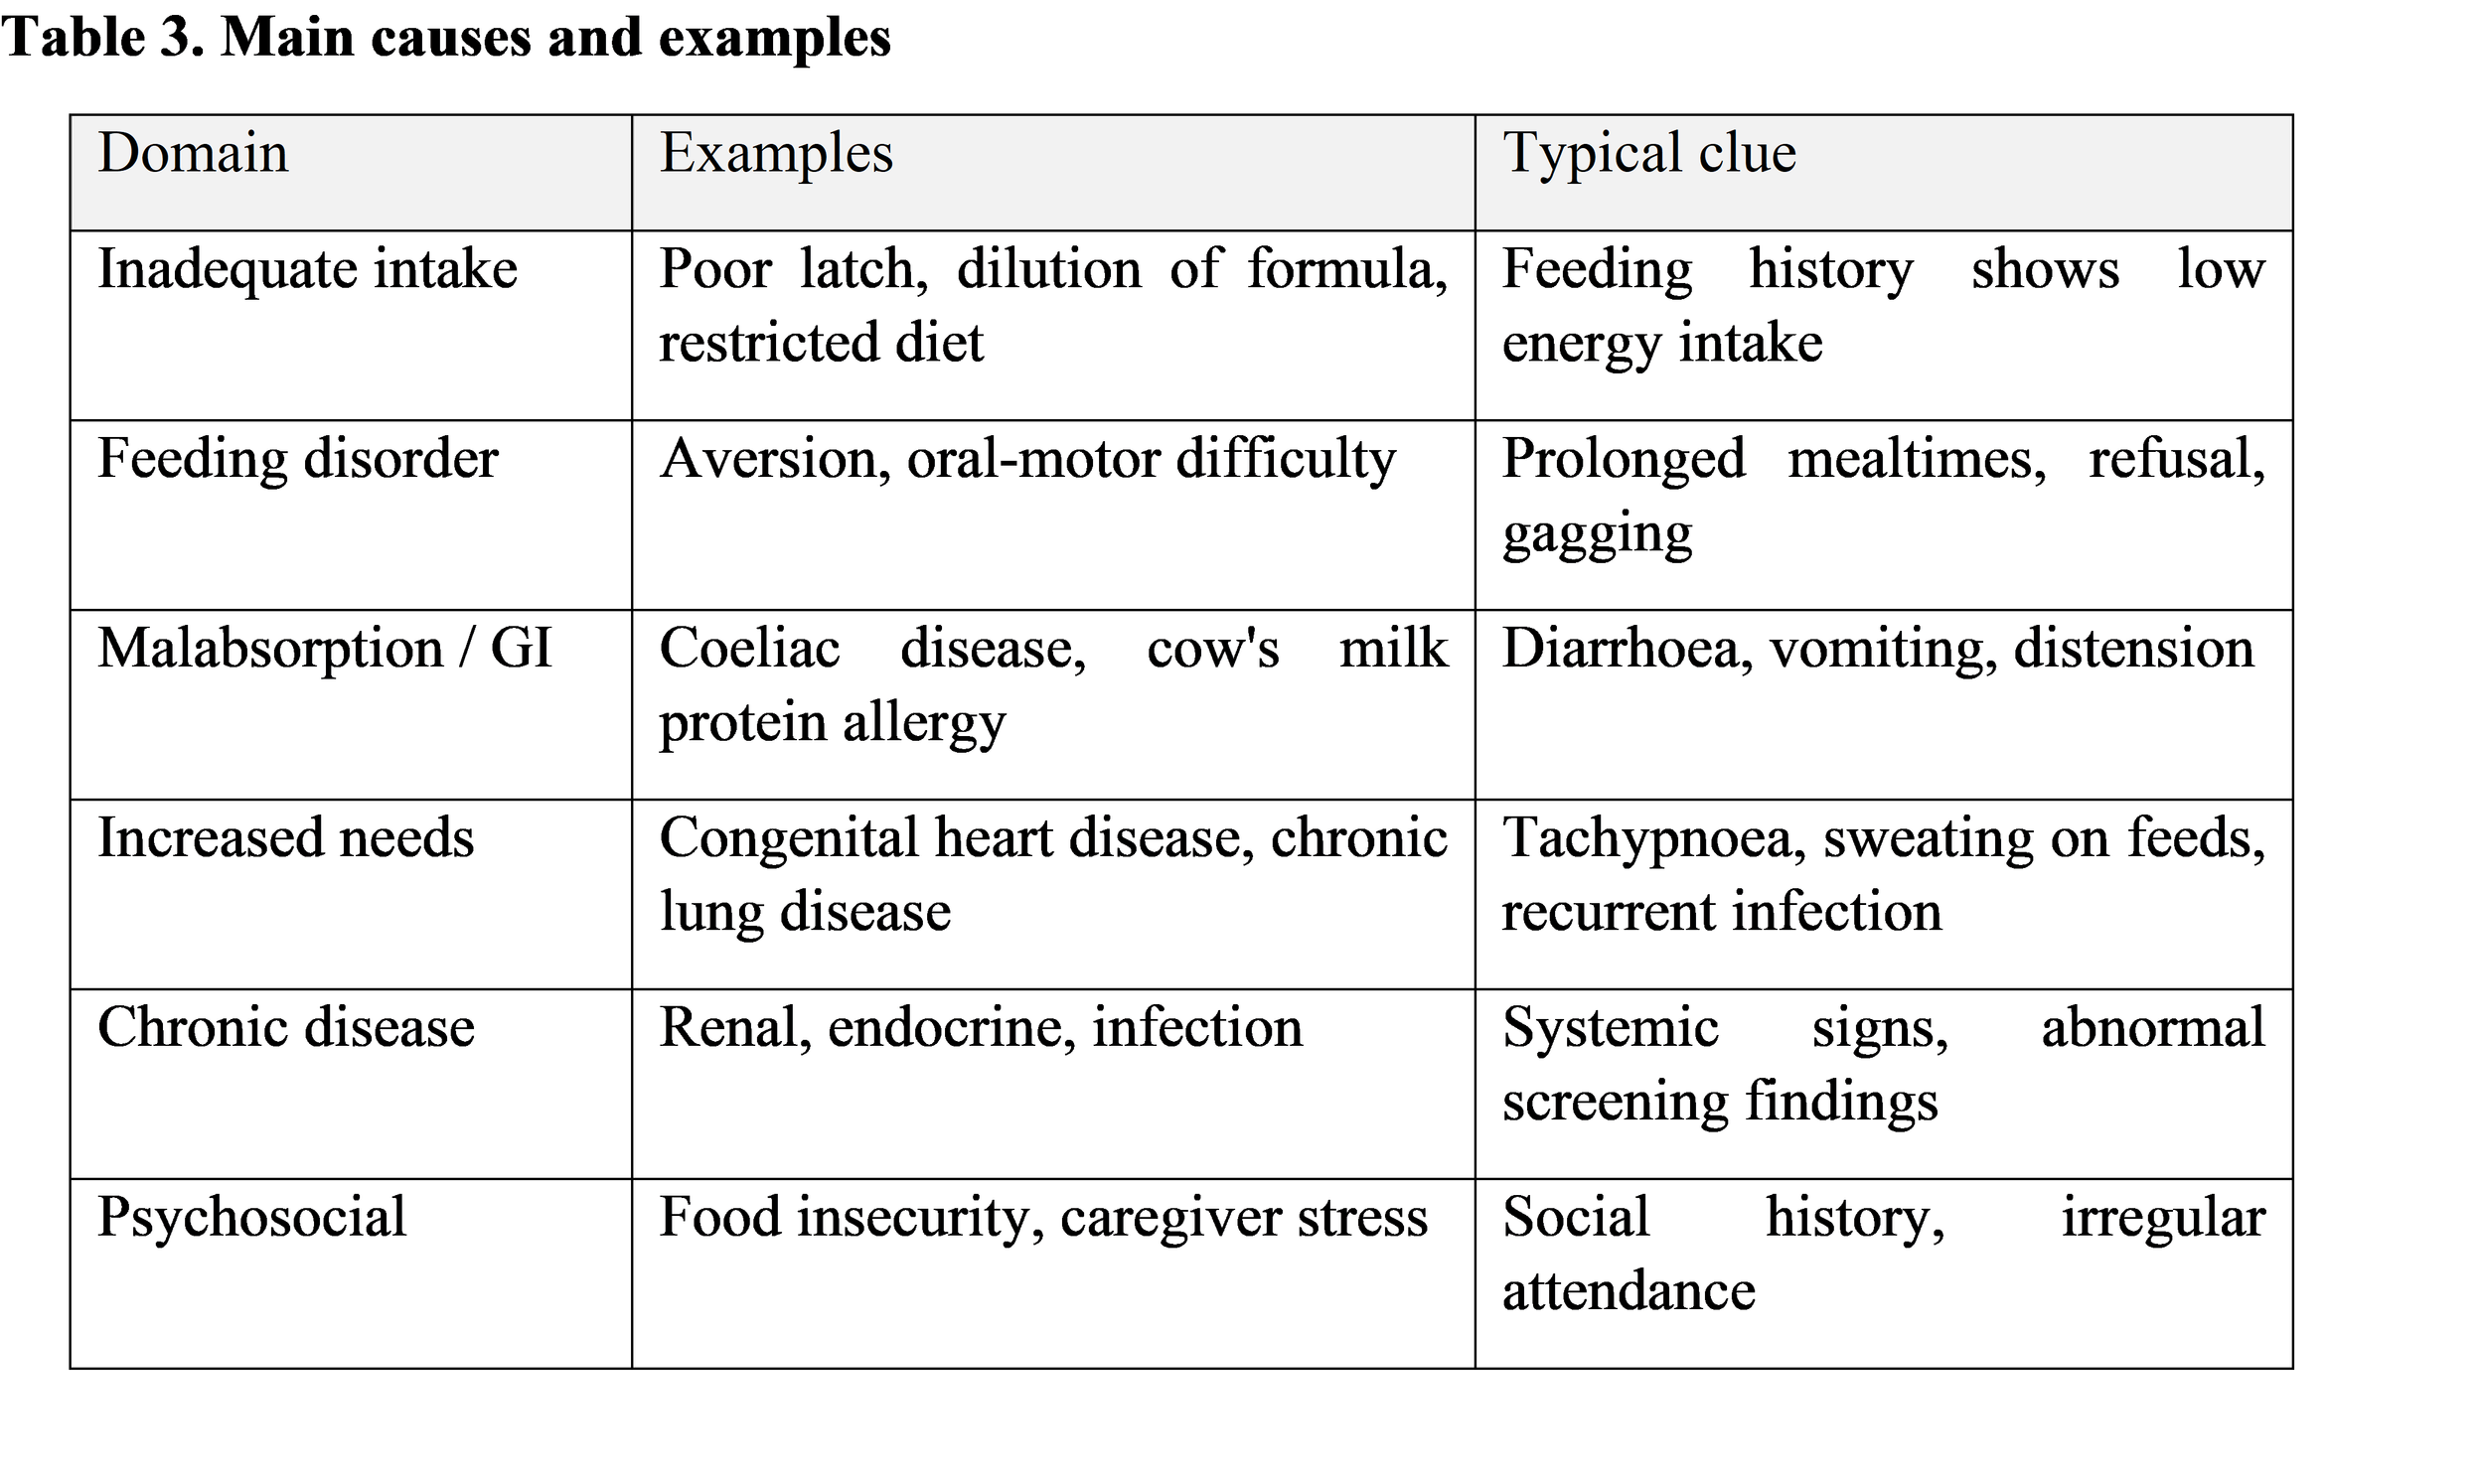
It helps to think about causes in four overlapping groups. In most children more than one is operating.
Nutritional causes. Insufficient energy intake is the most common explanation. Examples include breastfeeding difficulties with poor milk transfer, incorrectly prepared formula, delayed or poor-quality complementary feeding, restrictive diets, and micronutrient deficiencies such as iron and zinc that themselves reduce appetite and growth. Some children have a primary feeding disorder (aversion, sensory difficulty, oral-motor problems) without any underlying disease.
Medical and organic causes. Gastrointestinal conditions such as coeliac disease, food allergy, reflux and malabsorption; chronic respiratory disease; congenital heart disease; renal disorders; chronic infection; and endocrine disease. Though less common than inadequate intake, they are the causes that must not be missed.
Psychosocial and environmental factors. Caregiver feeding practices, food insecurity, caregiver mental health, family stress and wider social determinants. These are risk factors to explore sensitively. They are not proof of neglect, and the aim of exploring them is to find help, not to apportion blame.
Multifactorial interaction. A premature infant with reflux, a stressed parent and a tight household budget illustrates how medical, behavioural and social causes compound each other. A thorough assessment looks for all of them.
5. Anthropometric Assessment and Growth Monitoring
5.1 Measurements that matter
The core measurements are weight, length (lying down) for children under 2 and height (standing) from 2 years, and head circumference in infants and young children. From these we derive weight-for-age, length/height-for-age, weight-for-length/height and BMI-for-age. Mid-upper arm circumference is a quick, low-cost screening tool, especially in community and low-resource settings.
5.2 Charts and reference standards
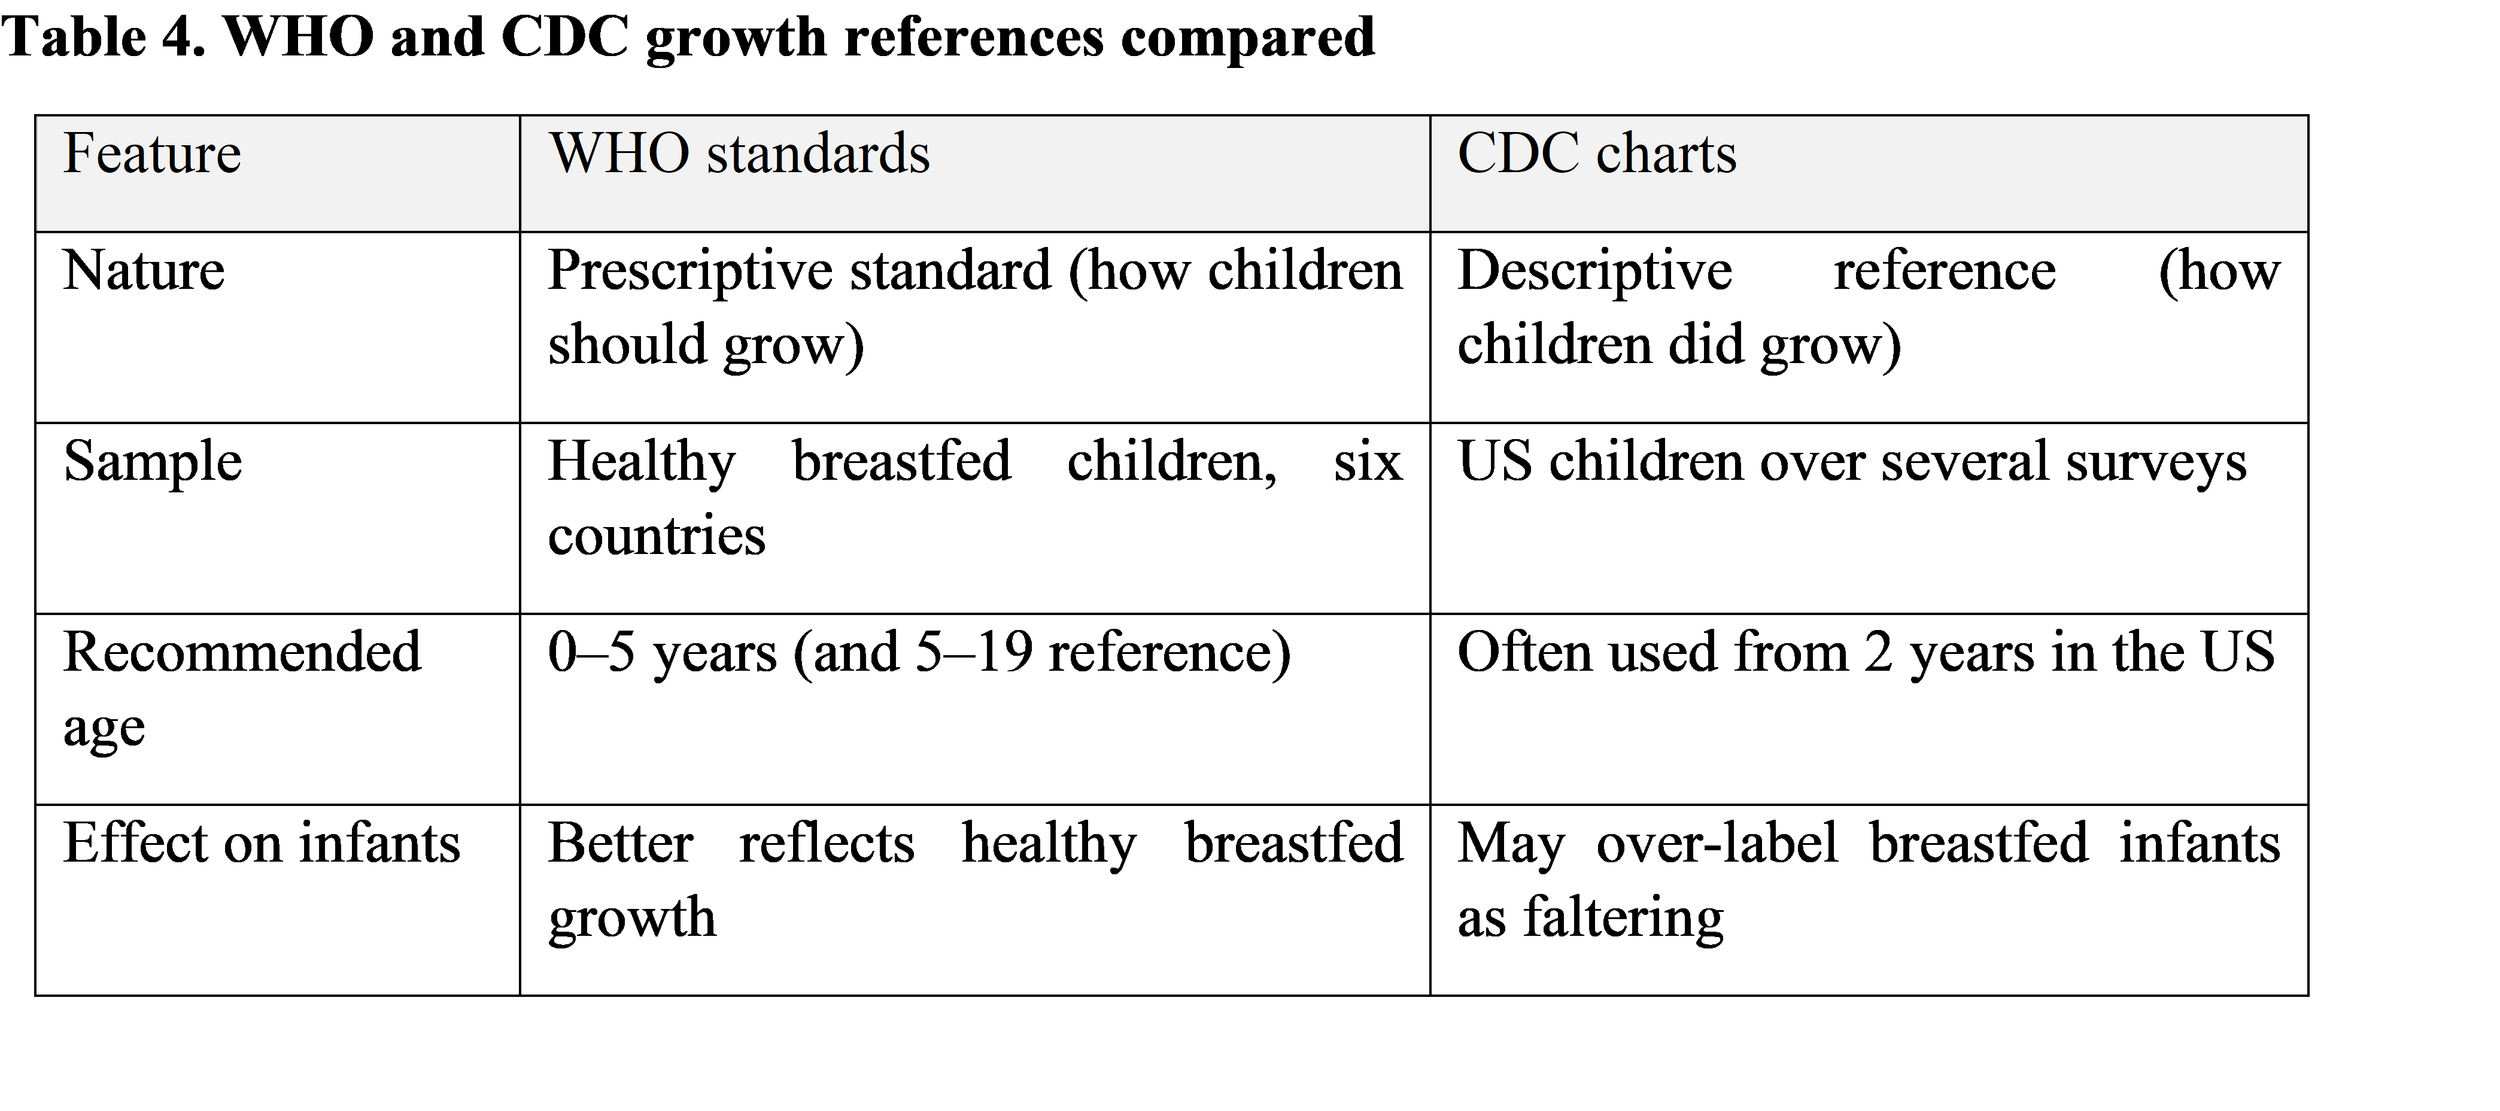
The WHO Child Growth Standards (2006) describe how children should grow under optimal conditions, drawn from a multi-country sample of healthy breastfed children, and are recommended for children under 5 [2]. The WHO growth reference for ages 5–19 years [3] extends this to school age and adolescence. The CDC charts describe how a particular US population did grow and are commonly used from age 2 in the United States; international bodies and the CDC itself recommend WHO standards for children under 2 [4].
A z-score expresses how many standard deviations a measurement lies above or below the median. It is more informative than a percentile at the extremes of the distribution, can be averaged and tracked over time, and, importantly, it is the language the new guideline speaks. Teaching families what a z-score means is explicitly encouraged.
5.3 Velocity and trajectory
One measurement shows where a child is. Several measurements show where the child is heading. A child who falls from the 50th to the 10th percentile is more worrying than one who has always tracked on the 10th, even though the latter is lighter at any single visit. Weight-gain velocity below −2 z-score in an infant under 2, or a fall of 1 z-score or more, are formal triggers under the new criteria [1]. Some downward drift in the first months is expected as infants settle to their genetic channel, so interpretation needs to account for birth weight and gestation.
5.4 Accuracy and limits
A large share of apparent growth faltering in practice is measurement error. Common causes are uncalibrated or unsuitable scales, children measured clothed, infants measured standing instead of lying, crown-to-heel length measured by one person without a proper board, and plotting on the wrong chart. A single measurement, however accurate, cannot establish a trend. Children with disabilities, contractures or scoliosis pose particular problems, and alternative techniques (segmental measures, disease-specific charts) may be needed.
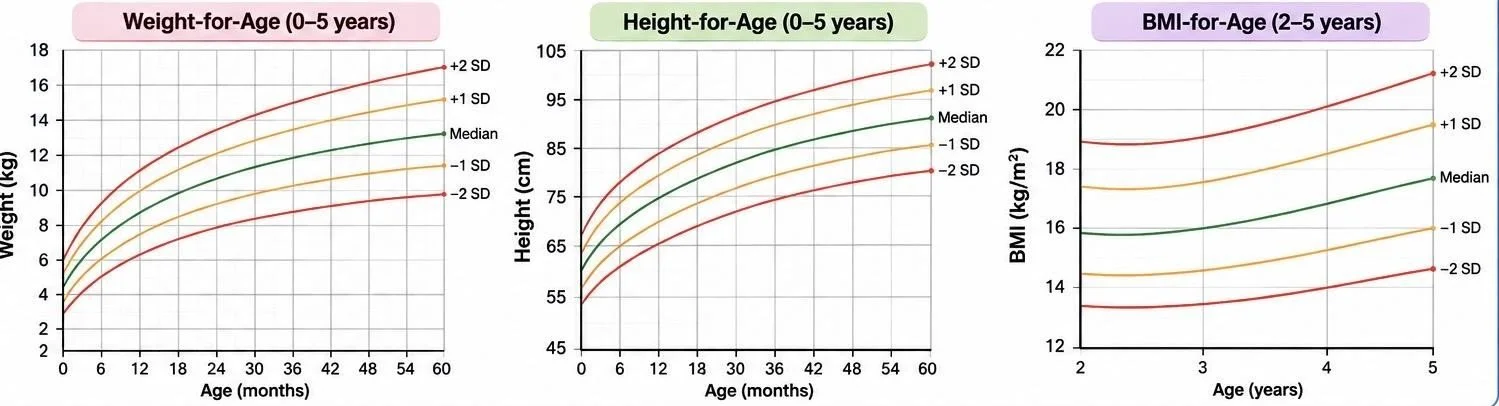
Figure 1 : Growth chart with weight, height and BMI monitoring.
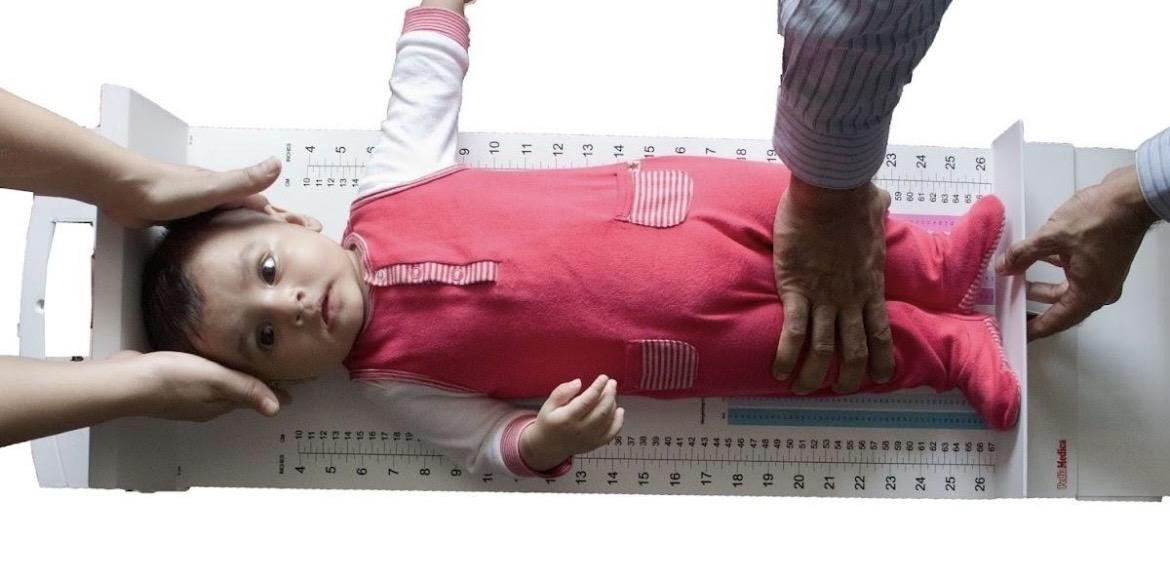
Figure 2 :Standard techniques for measuring weight, length, height and MUAC.
6. Clinical Assessment and Early Identification
6.1 History
The history is where most diagnoses are made. It should cover birth gestation and weight and any neonatal problems; feeding in detail (breast or formula, volumes, preparation, timing, who feeds, how mealtimes go, what is offered and what is eaten); gastrointestinal symptoms such as vomiting, stool pattern and abdominal pain; recurrent infection; developmental progress; parental heights and family growth history; and the social environment. A 24-hour recall or food diary, reviewed with a dietitian when possible, usually reveals more than any blood test.
6.2 Examination
Look at the child as a whole: alertness, interaction with the caregiver, signs of wasting (loss of subcutaneous fat over the buttocks and thighs, reduced muscle bulk), skin, hair and mucosal changes suggesting micronutrient deficiency, abdominal distension or masses, cardiac and respiratory signs, and dysmorphic features. Observe a feed if possible; watching a mealtime often explains the problem.
6.3 Warning signs
Features that should prompt closer attention include persistent poor weight gain, falling growth velocity, visible wasting, developmental delay, feeding difficulty, recurrent infections, and symptoms pointing to systemic disease (chronic diarrhoea, persistent vomiting, respiratory symptoms, heart murmur, polyuria).
6.4 Development
Gross and fine motor skills, language, cognition and social interaction should be reviewed at each assessment. Undernutrition and development are linked in both directions: poor nutrition can affect brain development, and a developmental problem can interfere with feeding. Delays in either direction should be acted on, not simply monitored [6].
7. Diagnostic Evaluation
7.1 A proportionate approach
The most practice-changing message of the recent guideline is restraint. For a child with faltering weight and no red flags in the history or examination, routine blood tests, stool studies and imaging add little. The guideline panel judged the evidence for routine testing to be of very low certainty, with trivial benefit and the potential for moderate harm [1]. That means false-positive results, distressing procedures and delay in starting what actually works, which is feeding.
The first step is therefore a comprehensive clinical assessment: review of previous growth records, accurate re-measurement, nutritional assessment and a search for specific features pointing towards an underlying condition.
7.2 When to test
Targeted testing is appropriate when history or examination suggest a particular condition, or when faltering is severe or persists beyond three months of well-delivered nutritional treatment. Depending on the picture, reasonable first-line tests include a full blood count, iron studies, electrolytes and renal function, liver function, and inflammatory markers; thyroid function when clinically indicated; and coeliac serology with stool investigations where gastrointestinal disease is suspected. Endoscopy should be reserved for children whose clinical picture requires it, for example persistent vomiting or other features of a specific gastrointestinal condition.
7.3 Differential diagnosis
When the problem is primarily short stature rather than low weight, constitutional growth delay and familial short stature are among the most common explanations and are usually identified through growth history, parental heights and bone age. Endocrine disorders, chronic systemic diseases, primary nutritional deficiencies, and genetic and metabolic conditions complete the list.
8. Evidence-Based Management
8.1 Nutrition first
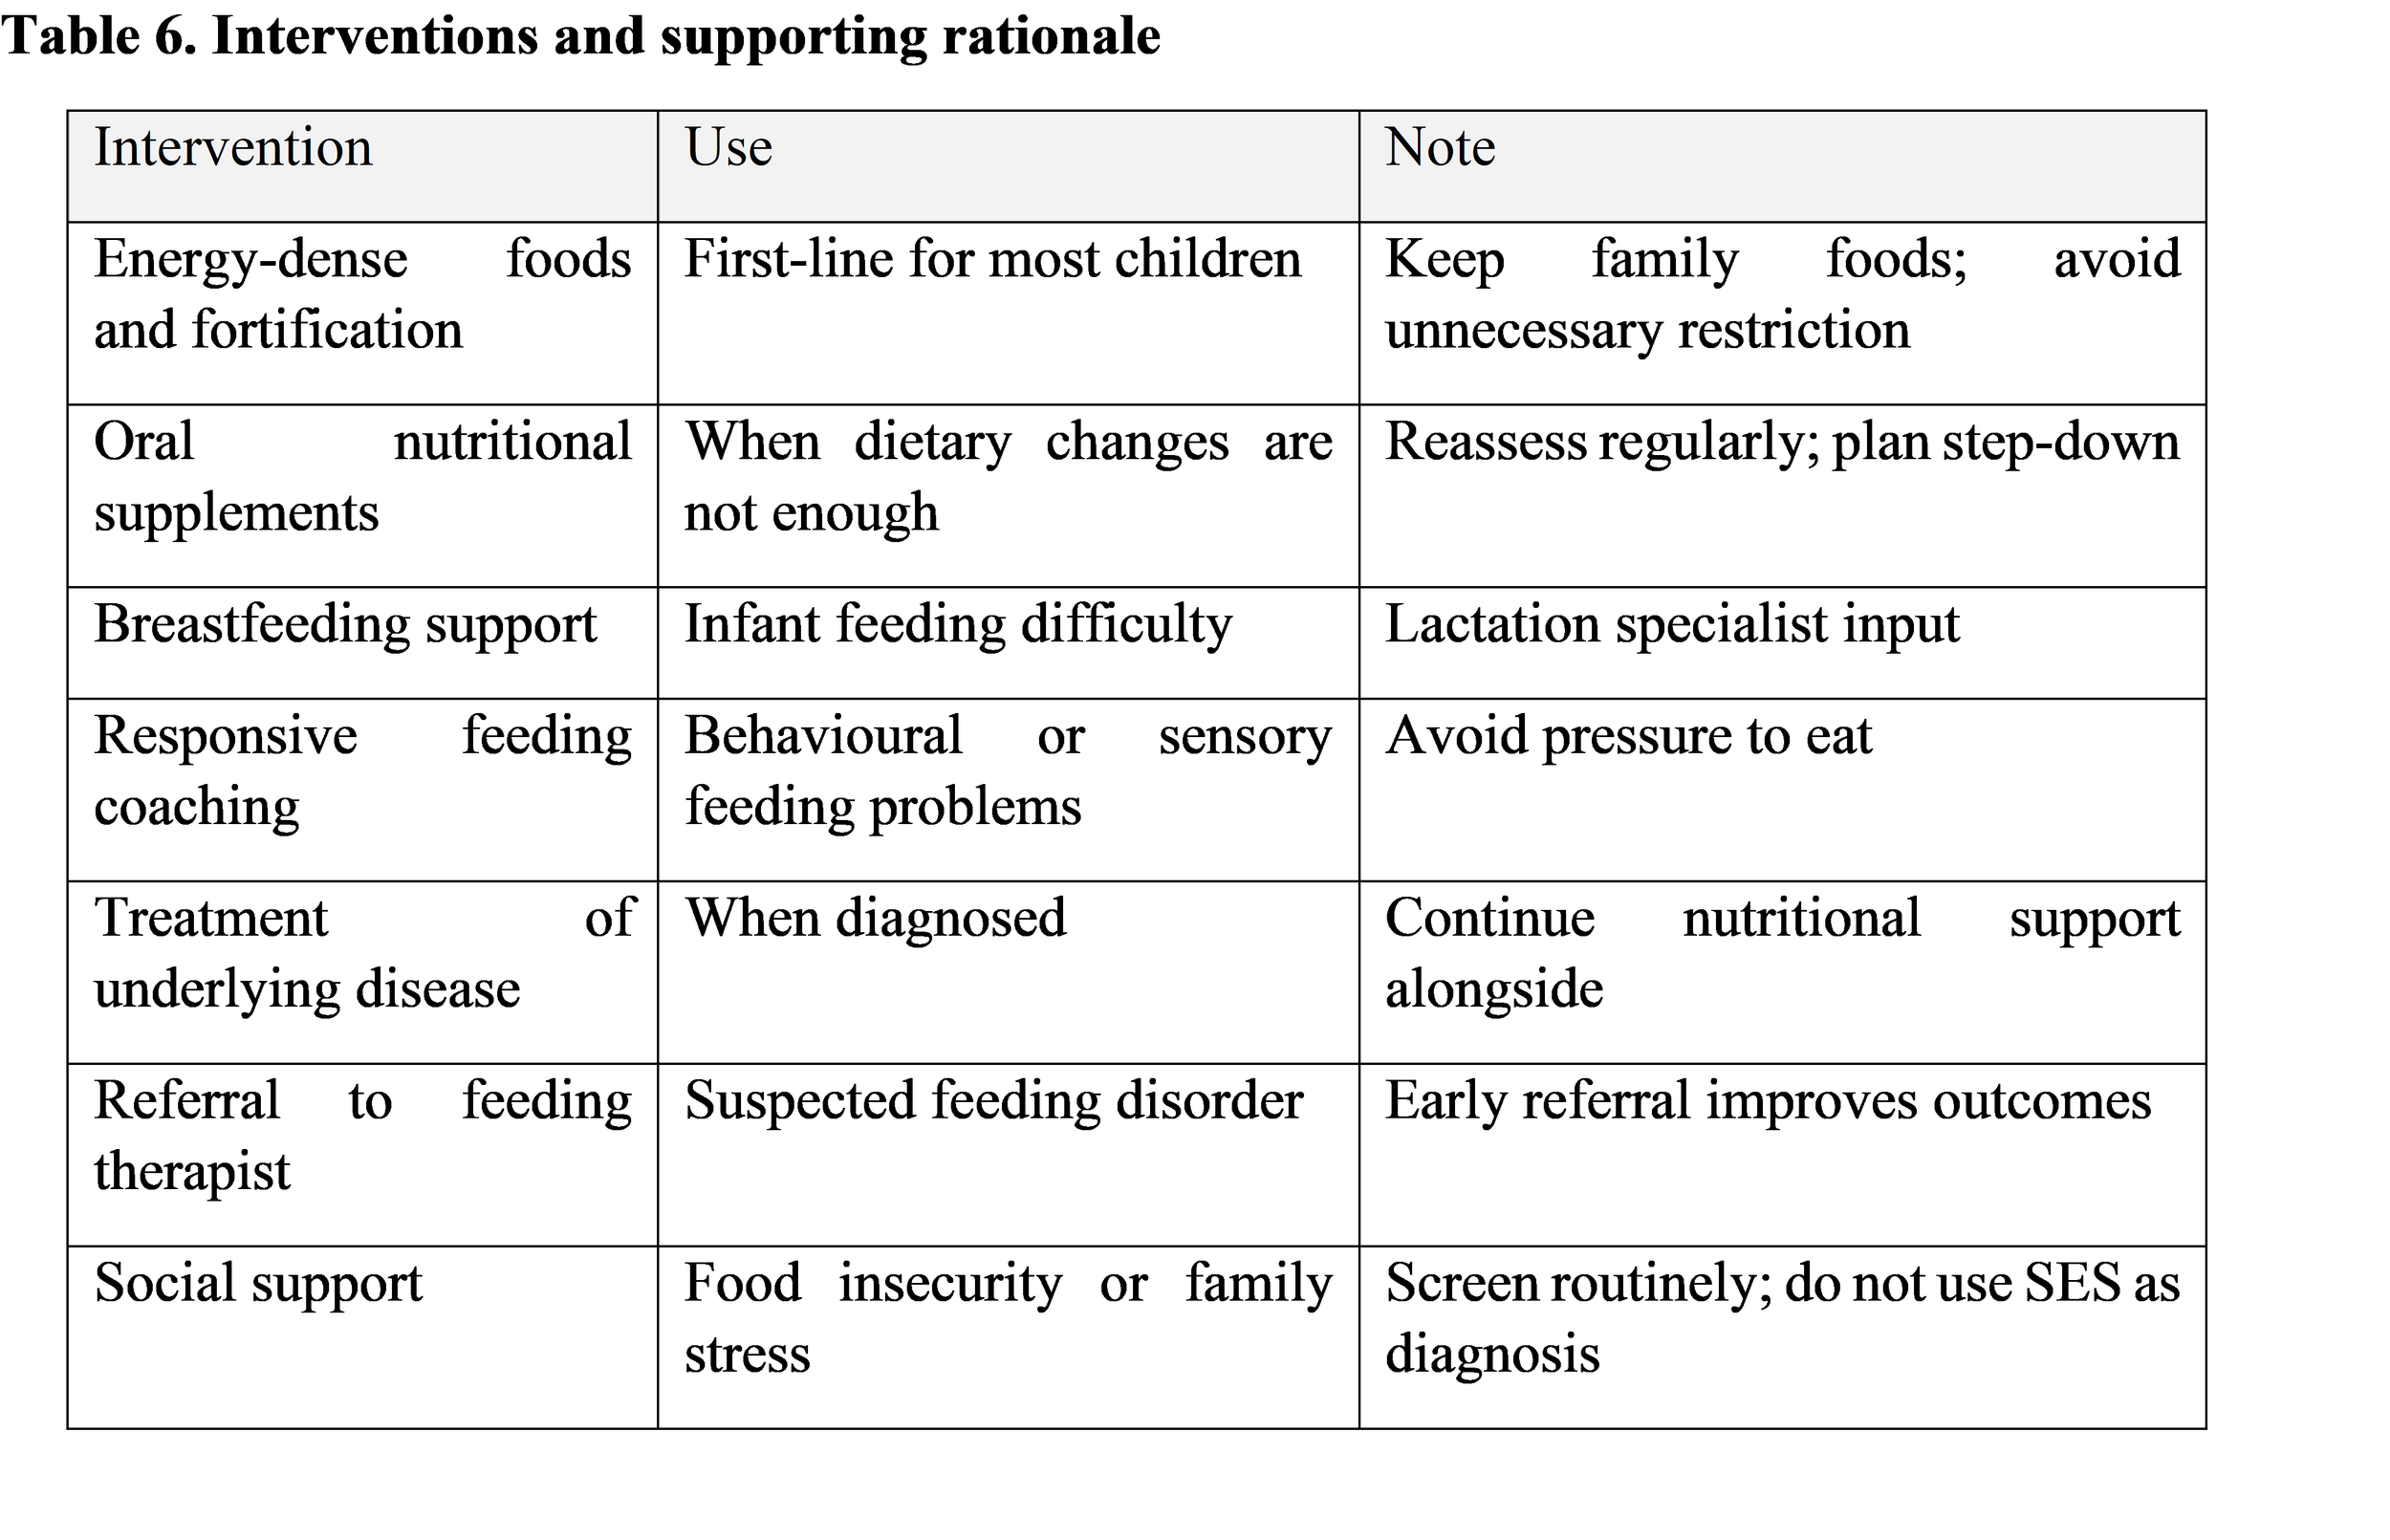
For most children the foundation of treatment is increasing energy and protein intake. The guideline recommends raising caloric intake through energy-dense foods, with oral nutritional supplements added when indicated [1]. In practice this means starting with what the child actually eats, then adjusting: fortifying familiar foods, offering regular meals and snacks, supporting breastfeeding with a lactation specialist when it is the issue, and ensuring complementary feeding is both timely and nutrient-dense. Supplements are a bridge, not a lifestyle.
8.2 Treating the underlying cause
If an organic cause is found it needs specific treatment: gluten exclusion for coeliac disease, appropriate management of reflux or allergy, correction of iron or zinc deficiency, cardiac or renal care as appropriate. Even then, nutritional rehabilitation continues in parallel.
8.3 Responsive feeding and behaviour
Many feeding problems are behavioural or sensory, and they are not improved by pressure. Responsive feeding means recognising hunger and fullness cues, keeping mealtimes calm and predictable, avoiding forced feeding and distractions, and giving parents concrete, supportive coaching. Children with a diagnosed paediatric feeding disorder benefit from referral to a speech-language or feeding therapist and, where needed, a psychologist. Education for caregivers should be practical and non-judgemental.
8.4 A team, not a lone clinician
Paediatricians lead the medical assessment, dietitians individualise nutrition plans, nurses support monitoring and family contact, speech and feeding therapists address oral-motor and sensory difficulties, psychologists support feeding behaviour and family coping, and social workers help families access food assistance, housing and income support. Family-centred care that reinforces a safe, stable and nurturing caregiver–child relationship is part of the intervention, not an optional extra.
8.5 Monitoring response
Treatment should be followed by regular weighing at an interval suited to age and severity, review of growth velocity and z-scores, reassessment of intake, and continued developmental monitoring. If weight does not respond within a few months to well-delivered treatment, that is the signal to widen the evaluation rather than simply increase the dose of advice.
9. Long-Term Consequences
Physical. Persistent undernutrition can lead to stunting, reduced muscle mass and weakened immune function, with a higher burden of infection.
Neurodevelopmental. The brain is especially vulnerable in the first two years. Studies link early undernutrition with poorer cognitive performance, learning difficulty and behavioural change, although the extent depends on severity, duration and the quality of the surrounding environment [6]. Early, adequate intervention is the best protection.
Longer-term. Reduced physical capacity, greater vulnerability to illness, lower educational attainment and long-term metabolic consequences have all been described, especially in settings where undernutrition is chronic [5]. It is worth saying clearly that many children with mild, short-lived faltering recover fully. The aim is to identify the children for whom it is not mild or short-lived.
10. Prevention and Public Health
Prevention begins before birth, with good maternal nutrition and antenatal care. After birth, the main levers are promotion and protection of breastfeeding, timely and appropriate complementary feeding, routine growth monitoring at primary-care contacts, and community-based screening, for instance with MUAC. Parent and caregiver education, food-security programmes and national or international child-nutrition initiatives support these efforts. Growth monitoring only works when someone acts on what it shows: a chart that is filled in but not interpreted has little value.
11. Challenges in Practice and in Resource-Limited Settings
The guidance described above assumes accurate equipment, trained staff and the ability to follow children over time. Many settings do not have all three. Common obstacles include scarce or poorly maintained scales and length boards, irregular growth monitoring, shortages of trained staff, late recognition of abnormal growth, limited access to specialist investigations, nutritional insecurity, and culturally embedded feeding practices that may or may not be favourable. Even in well-resourced systems, adopting a new guideline takes time: switching clinics from percentile charts to z-scores requires software, training and family-facing explanations.This is where the evidence is weakest. Most guideline development has taken place in high-income settings, and the criteria have not been widely validated for programmes where stunting and wasting are the dominant problems. Pragmatic, low-cost adaptations (MUAC-based screening, simplified z-score charts, community health worker training) deserve more rigorous evaluation.
12. Discussion
Three points emerge from this review.
First, definitions matter. The move from percentiles and loosely used labels to explicit z-score thresholds is a clear gain for consistency, audit and research. Earlier definitions varied so widely that prevalence figures and treatment studies were hard to compare [7]. Yet the new criteria are new. Their performance in practice, in different ethnic groups and in preterm infants, remains to be shown, and a single set of thresholds will inevitably flag some children who are healthy and miss some who are not.
Second, charts are tools, not verdicts. WHO standards and CDC references answer different questions, and using the wrong one can create or hide a problem. Breastfed infants, preterm infants and children with syndromes may not follow standard curves. Clinical judgement, parental heights and trajectory still count.
Third, early intervention works best when it is proportionate. The emphasis on history, examination and feeding assessment over routine laboratory testing appears sound, although the underlying evidence is rated as low certainty, and the guideline itself calls for further research [1]. Trials comparing different intensities and delivery models of nutritional therapy, and long-term follow-up of neurodevelopment after treated faltering weight, are still limited.
Several gaps stand out: the validation of z-score criteria across diverse populations; the effect of the new diagnostic approach on testing rates and outcomes; the accuracy of growth monitoring in primary care; and how best to implement standardised criteria in low-resource health systems.
13. Future Perspectives
Digital growth charts that calculate z-scores and velocity automatically could reduce plotting errors and flag deviations earlier. Machine-learning tools may eventually predict which children are likely to falter, although such models need careful validation across populations and should support rather than replace clinical judgement. Better measurement technologies, from improved infant length devices to smartphone-based methods, may help in places where equipment is scarce. Personalised nutrition, based on a child's intake, illness profile and feeding behaviour, is another promising direction. And above all, folding growth monitoring into primary healthcare routinely, with clear pathways for action, is likely to do more good than any single technological advance.
14. Conclusion
Faltering growth is common, often preventable and usually treatable, provided it is recognised early and measured accurately. The recent AAP/NASPGHAN guideline gives clinicians a shared vocabulary and objective thresholds for faltering weight, and it makes a persuasive case for a measured work-up that prioritises history, measurement and feeding. It should not be stretched to cover stunting, wasting or linear growth problems, which need their own assessment. For clinical practice, the message is simple: measure carefully, follow the trajectory, treat feeding first, investigate selectively, involve a team and support the family. For research and policy, the pressing task is making all of this work in the places where children are most at risk.
References
1. Kersten, H. B., Goday, P. S., Abdelhadi, R., Adolphe, S., Anania, N., Bennett, D. S., Burke, L. W., Larson-Nath, C., Lee, T. M., Leu, M. G., Mercer, S., Sentongo, T., Goswami Vachani, J., Senerth, E., Pilcher, L., Flinn, S. K., Okechukwu, K., Mustafa, R. A., & Morgan, R. L. (2026). Clinical practice guideline for diagnosis and management of faltering weight. Pediatrics, 157(4), e2025075764. https://doi.org/10.1542/peds.2025-075764
2. WHO Multicentre Growth Reference Study Group. (2006). WHO child growth standards: Length/height-for-age, weight-for-age, weight-for-length, weight-for-height and body mass index-for-age: Methods and development. World Health Organization.
3. de Onis, M., Onyango, A. W., Borghi, E., Siyam, A., Nishida, C., & Siekmann, J. (2007). Development of a WHO growth reference for school-aged children and adolescents. Bulletin of the World Health Organization, 85(9), 660–667. https://doi.org/10.2471/BLT.07.043497
4. Grummer-Strawn, L. M., Reinold, C., & Krebs, N. F. (2010). Use of World Health Organization and CDC growth charts for children aged 0–59 months in the United States. MMWR Recommendations and Reports, 59(RR-9), 1–15.
5. Black, R. E., Victora, C. G., Walker, S. P., Bhutta, Z. A., Christian, P., de Onis, M., Ezzati, M., Grantham-McGregor, S., Katz, J., Martorell, R., & Uauy, R. (2013). Maternal and child undernutrition and overweight in low-income and middle-income countries. The Lancet, 382(9890), 427–451. https://doi.org/10.1016/S0140-6736(13)60937-X
6. Prado, E. L., & Dewey, K. G. (2014). Nutrition and brain development in early life. Nutrition Reviews, 72(4), 267–284. https://doi.org/10.1111/nure.12102
7. Olsen, E. M. (2006). Failure to thrive: Still a problem of definition. Clinical Pediatrics, 45(1), 1–6. https://doi.org/10.1177/000992280604500101